FACS Based Analysis
Flow cytometry has various research applications including immunophenotyping, measuring intracellular cytokine production, cellular proliferation, assessing cell viability and analysis of cell cycle, rare events, stem cells and fluorescent proteins. Cellomatics has dedicated state of the art equipment and high level technical know-how to effectively deploy this technology to client projects.
Neutrophil characterisation
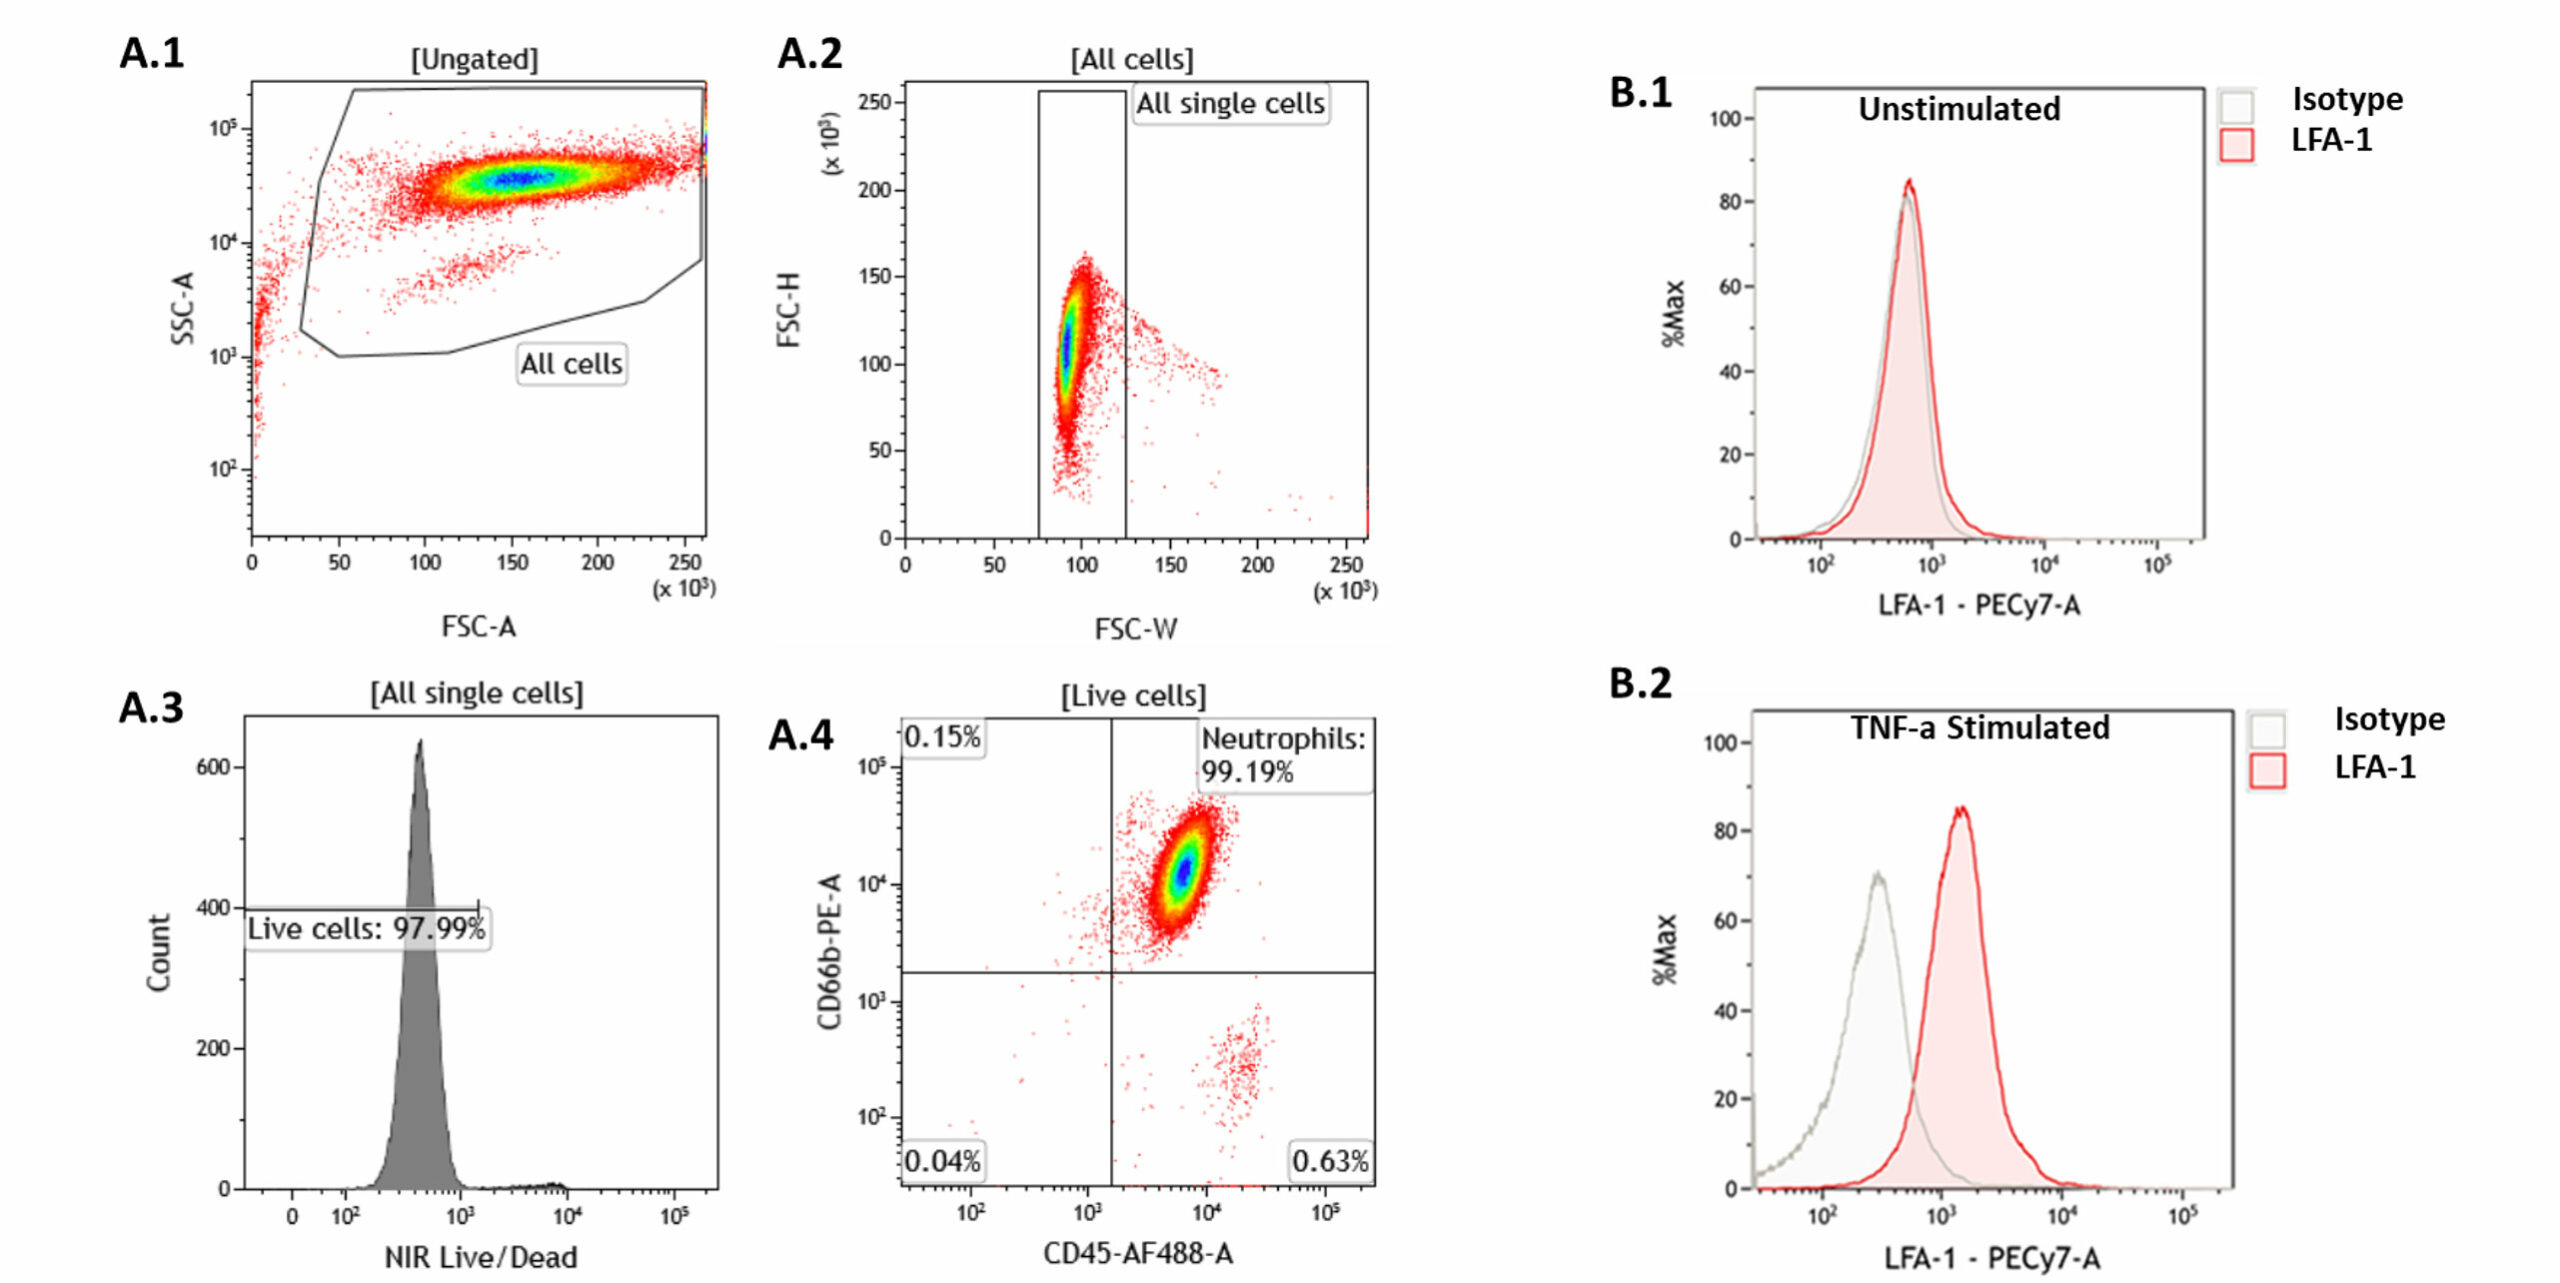
Neutrophil characterisationNeutrophils were isolated from fresh peripheral blood using a commercially available isolation kit (details) and the purity of cells was subsequently analysed by FACS for neutrophil surface markers (CD45 and CD66b). Figures A.1- A.4 represent the gating strategy employed for characterisation of neutrophils. The neutrophil population was subsequently stimulated with [concentration] TNFα for 4 hours and an increase in cells expressing the LFA-1 surface antigen was observed (B1, 2).
T-cell subpopulation characterisation: CD4+, CD27+, CD28+
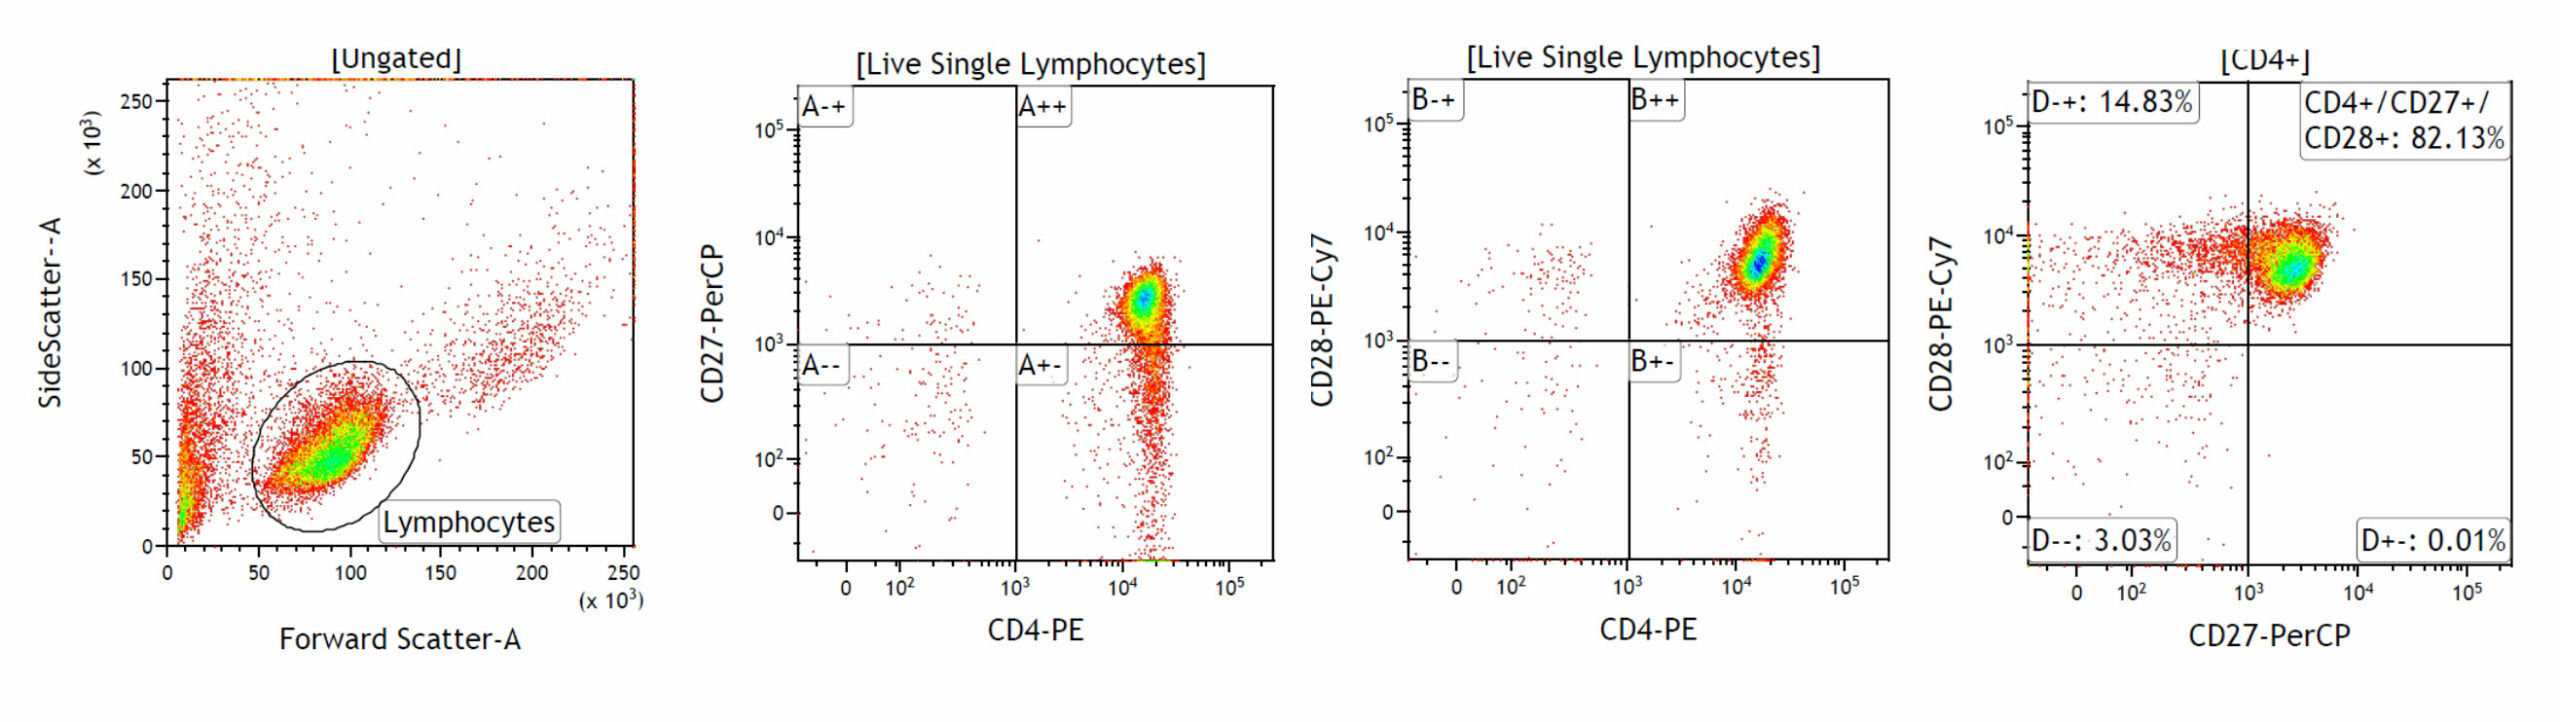
T-cell subpopulation characterisation: CD4+, CD27+, CD28+ T-cell lymphocytes were isolated from peripheral blood using commercially available isolation kits. To characterise the subpopulation of CD4+T-cells, the lymphocytes were stained for surface markers (CD4, CD27, CD28) along with viability dye and analysed by FACS. The CD4+T cells were further sub-characterised and 82.13% cells were positive for CD4, CD27 and CD28. The expression of these co-stimulatory markers is helpful in investigating the immune responses in young and old donors.
Regulatory T (TReg)-Cell Characterisation: CD4+CD25+CD127dim/-
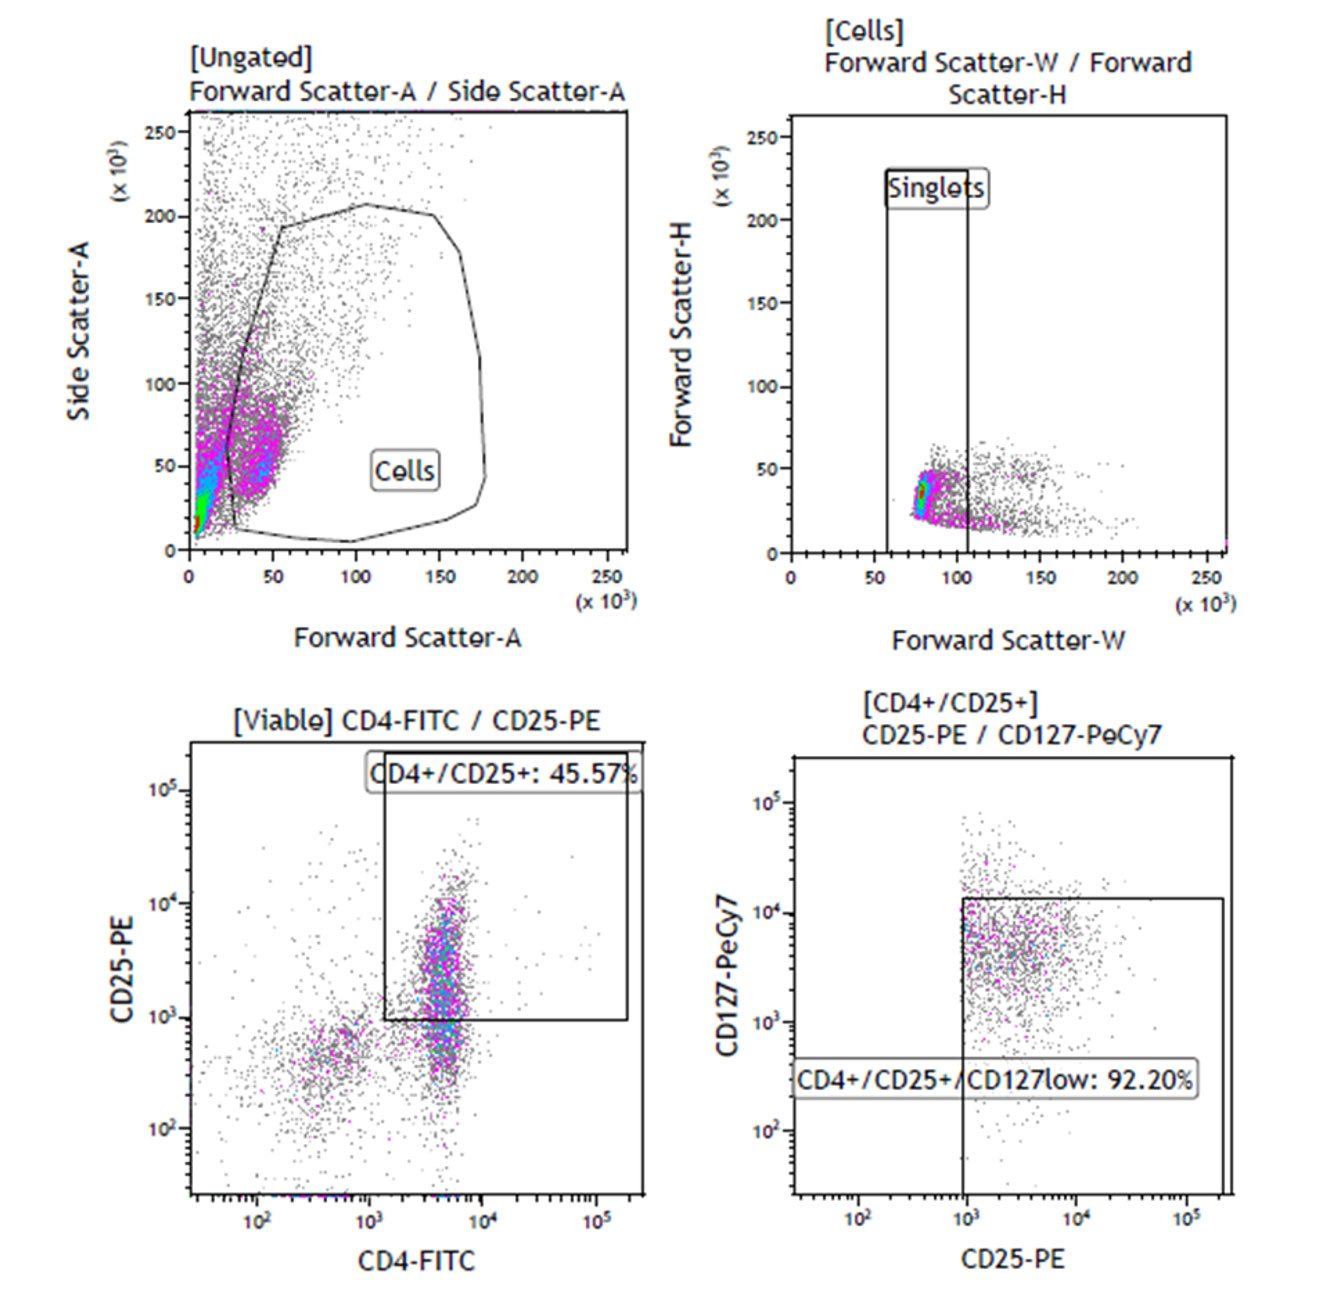
Regulatory T (TReg)-Cell Characterisation: CD4+CD25+CD127dim/- Regulatory T cells (T Reg) were isolated from peripheral blood using commercially available isolation kits. The cells were labelled with CD4, CD25 and CD127. 45.57% of the cells were CD4+CD25+; within this a sub-population of 92.20% of the CD4+CD25+ cells expressed low levels of the CD127 surface antigen.
THP-1 characterisation after PMA-differentiation
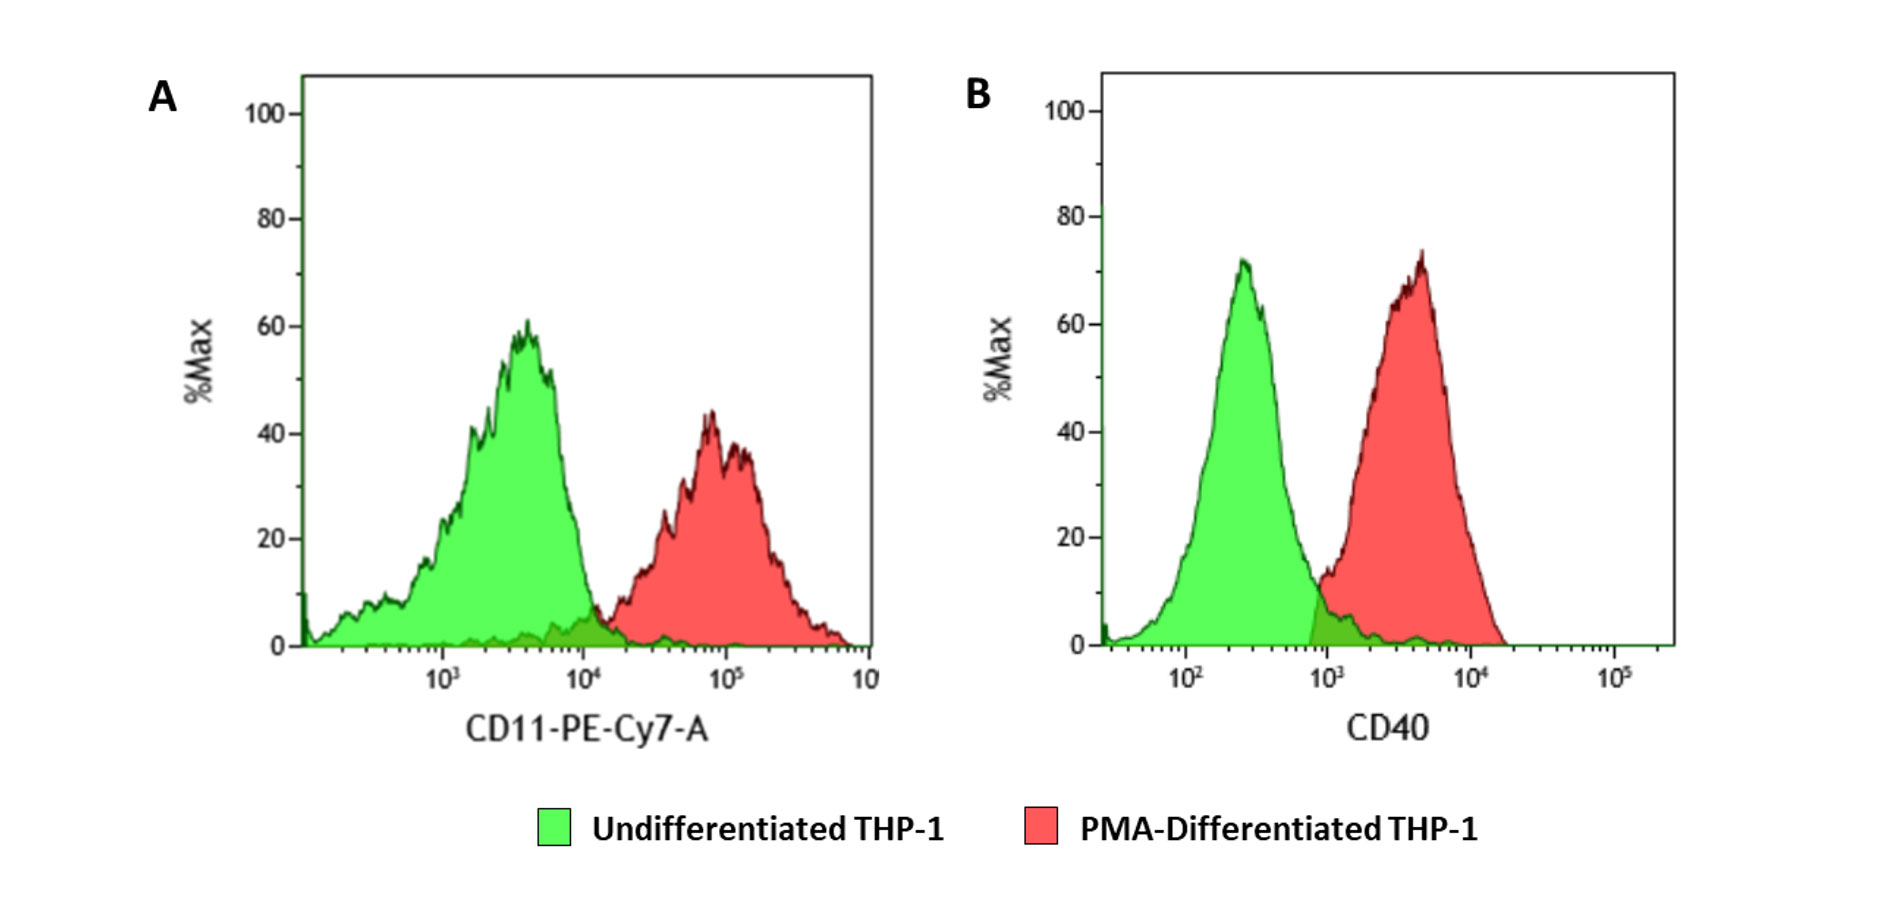
THP-1 characterisation after PMA-differentiation Stimulation of THP-1 cells (human monocyte model) with PMA induces differentiation and expression of a macrophage-like phenotype. The PMA-differentiated THP-1 cells were stained with macrophage surface markers (CD11; CD40) and analysed using FACS. Figures A and B demonstrate that the expression of CD11 and CD40 was higher following PMA-induced differentiation of THP-1 cells (red) when compared to undifferentiated cells (green).
Quantitative data of primary-derived human macrophage characterisation by flow cytometry
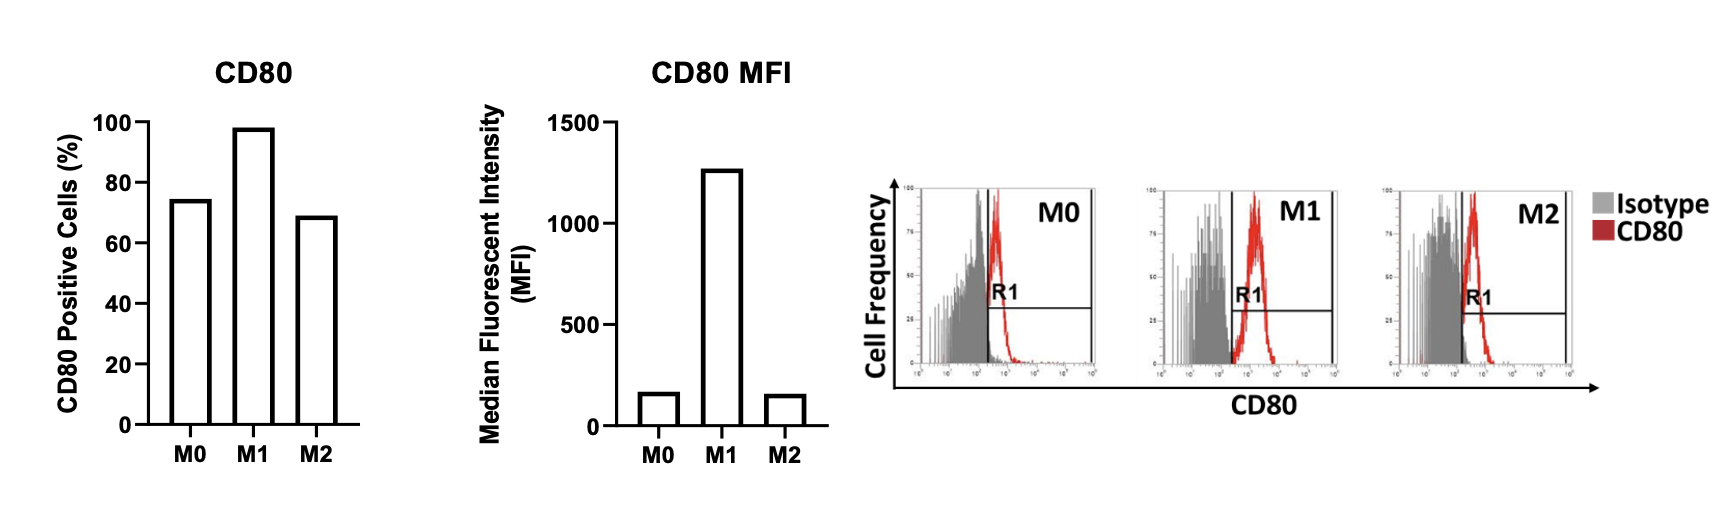
Cell surface expression of CD80 on M0, M1 and M2 primary derived human macrophages. The percentage of CD80 positive cells is graphed alongside the median fluorescent intensity (MFI) of CD80 expression for M0, M1 and M2 primary derived human macrophages. Flow cytometry plots demonstrate the level of CD80 expressed by the different macrophage types. Data normalised to the appropriate isotype controls.
Quantitative data of primary-derived human macrophage characterisation by flow cytometry
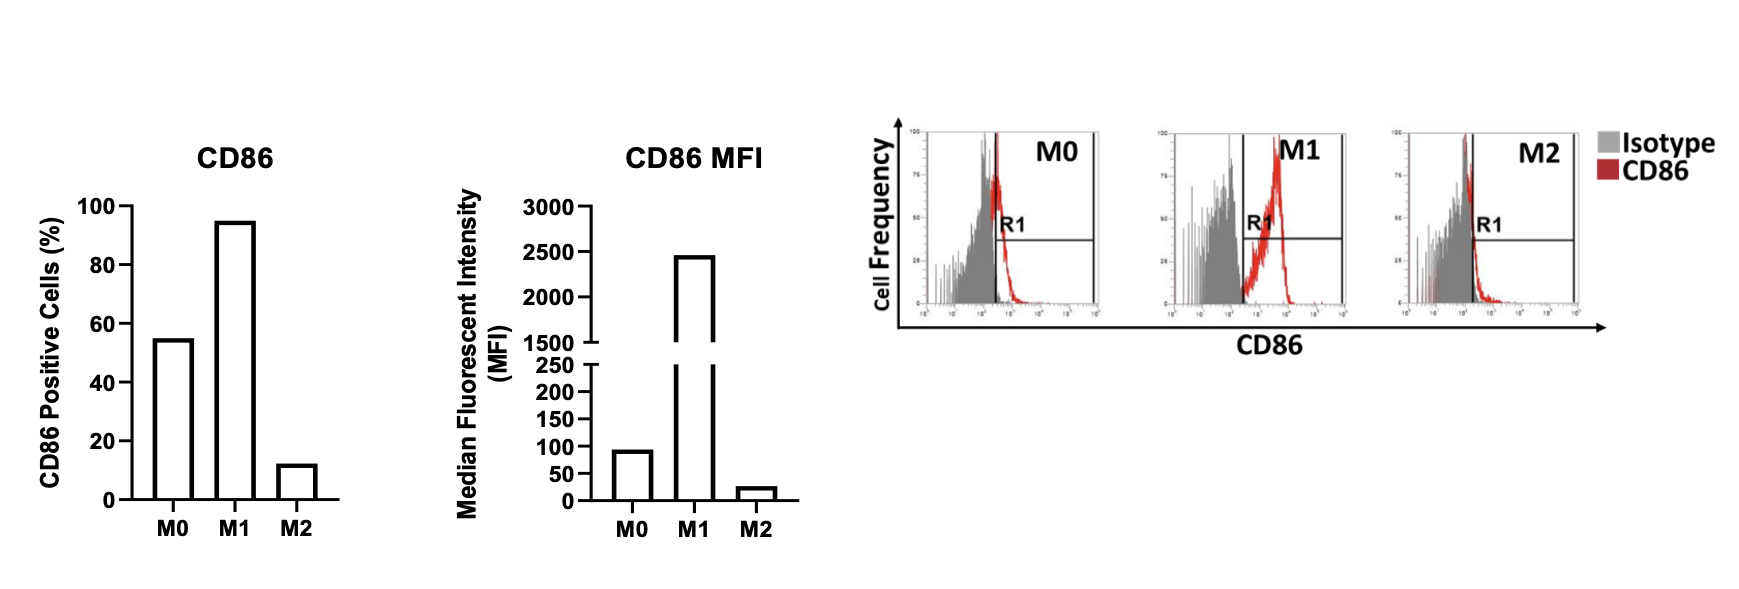
Cell surface expression of CD86 on M0, M1 and M2 primary derived human macrophages. The percentage of CD86 positive cells is graphed alongside the median fluorescent intensity (MFI) of CD86 expression for M0, M1 and M2 primary derived human macrophages. Flow cytometry plots demonstrate the level of CD86 expressed by the different macrophage types. Data normalised to the appropriate isotype controls.
Quantitative data of primary-derived human macrophage characterisation by flow cytometry

Cell surface expression of CD206 on M0, M1 and M2 primary derived human macrophages. The percentage of CD206 positive cells is graphed alongside the median fluorescent intensity (MFI) of CD260 expression for M0, M1 and M2 primary derived human macrophages. Flow cytometry plots demonstrate the level of CD206 expressed by the different macrophage types. Data normalised to the appropriate isotype controls. ND = Not detectable
Quantitative data of primary-derived human macrophage characterisation by flow cytometry

Cell surface expression of CD80, CD86 and CD206 on M0, M1 and M2 primary derived human macrophages. The percentage positivity is graphed alongside the median fluorescent intensity (MFI) of CD80, CD86 and CD206 expression for M0, M1 and M2 primary derived human macrophages. M0 macrophages display a CD80 high, CD86 low, CD206 low phenotype. M1 macrophages display a CD80 high, CD86 high, CD206 low phenotype. M2 macrophages display a CD80 high, CD86 low, and CD206 high phenotype. Data normalised to the appropriate isotype controls. ND = Not detectable
Request a consultation with Cellomatics Biosciences today
Our experienced team of in vitro laboratory scientists will work with you to understand your project and provide a bespoke project plan with a professional, flexible service and a fast turnaround time.
To request a consultation where we can discuss your exact requirements, please contact Cellomatics Biosciences.