Macrophage Based Assays
Macrophages are effector cells of the innate immune system that phagocytose bacteria and secrete both pro-inflammatory and antimicrobial mediators. In addition, macrophages play an important role in eliminating diseased and damaged cells through their programmed cell death. They regulate lymphocyte activation and proliferation. They are essential in the activation process of T- and B-lymphocytes by antigens and allogenic cells. Enhanced bactericidal activity of “activated macrophages” is based on immunologically linked mechanisms involving lymphocytes.
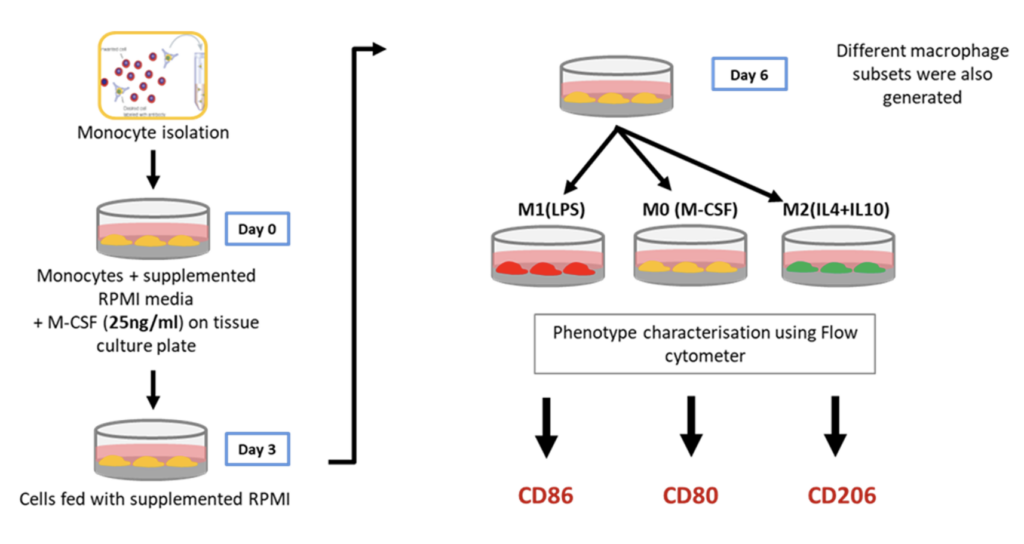
Differentiation of primary CD14+ monocytes to macrophages
Quantitative data of primary-derived human macrophage characterisation by flow cytometry

Cell surface expression of CD80 on M0, M1 and M2 primary derived human macrophages. The percentage of CD80 positive cells is graphed alongside the median fluorescent intensity (MFI) of CD80 expression for M0, M1 and M2 primary derived human macrophages. Flow cytometry plots demonstrate the level of CD80 expressed by the different macrophage types. CD80 is expressed in a high proportion of all macrophage types, but this is only observed at a high MFI on M1 type macrophages. Data is presented here represents n=1 replicate. Data was normalised to the appropriate isotype controls.
Quantitative data of primary-derived human macrophage characterisation by flow cytometry
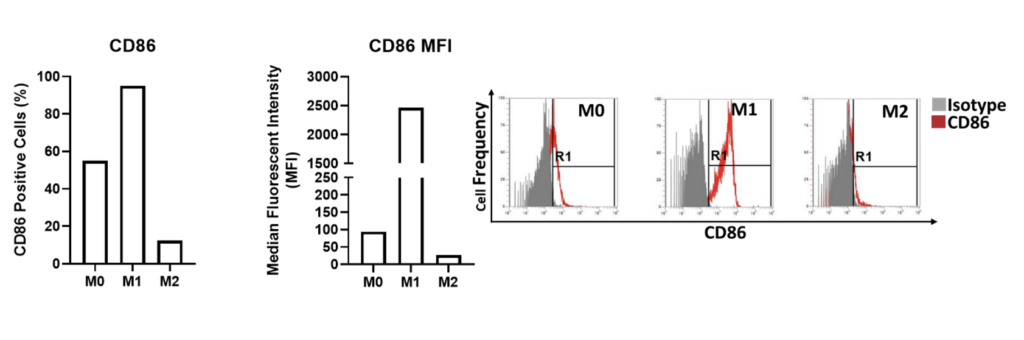
Cell surface expression of CD86 on M0, M1 and M2 primary derived human macrophages. The percentage of CD86 positive cells is graphed alongside the median fluorescent intensity (MFI) of CD86 expression for M0, M1 and M2 primary derived human macrophages. Flow cytometry plots demonstrate the level of CD86 expressed by the different macrophage types. CD86 is expressed by a high proportion of M1 type macrophages at a high MFI compared to the other macrophage types. M2 macrophages express the lowest frequency and level of CD86 expression. Data is presented here represents n=1 replicate. Data was normalised to the appropriate isotype controls.
Quantitative data of primary-derived human macrophage characterisation by flow cytometry
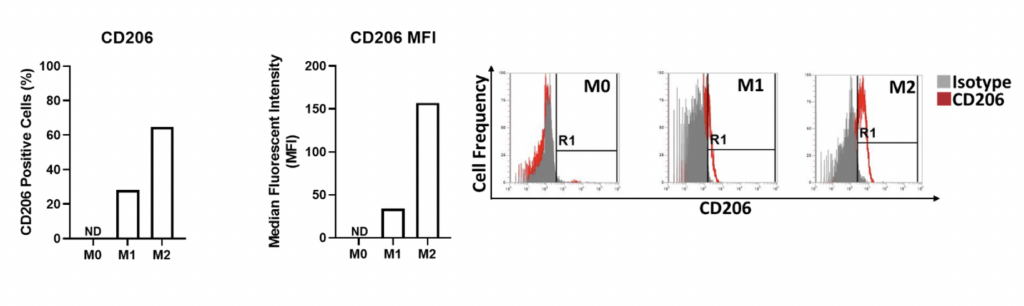
Cell surface expression of CD206 on M0, M1 and M2 primary derived human macrophages. The percentage of CD206 positive cells is graphed alongside the median fluorescent intensity (MFI) of CD260 expression for M0, M1 and M2 primary derived human macrophages. Flow cytometry plots demonstrate the level of CD206 expressed by the different macrophage types. M2 type macrophages display the highest frequency and MFI of CD206 expression. CD206 expression is not detectable (ND) by M0 macrophages and is only expressed on a low proportion of M1 macrophages at a low MFI. Data is presented here represents n=1 replicate. Data was normalised to the appropriate isotype controls. ND = Not detectable.
Quantitative data of primary-derived human macrophage characterisation by flow cytometry
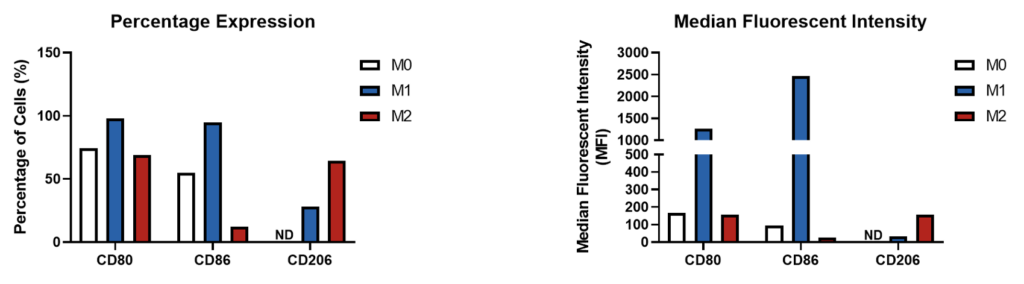
Cell surface expression of CD80, CD86 and CD206 on M0, M1 and M2 primary derived human macrophages. The percentage positivity is graphed alongside the median fluorescent intensity (MFI) of CD80, CD86 and CD206 expression for M0, M1 and M2 primary derived human macrophages. M0 macrophages display a CD80 high, CD86 low, CD206 low phenotype. M1 macrophages display a CD80 high, CD86 high, CD206 low phenotype. M2 macrophages display a CD80 high, CD86 low, and CD206 high phenotype. Data is presented here represents n=1 replicate. Data was normalised to the appropriate isotype controls. ND = Not detectable.
Difference in phagocytic potential of M1 and M2 MΦ
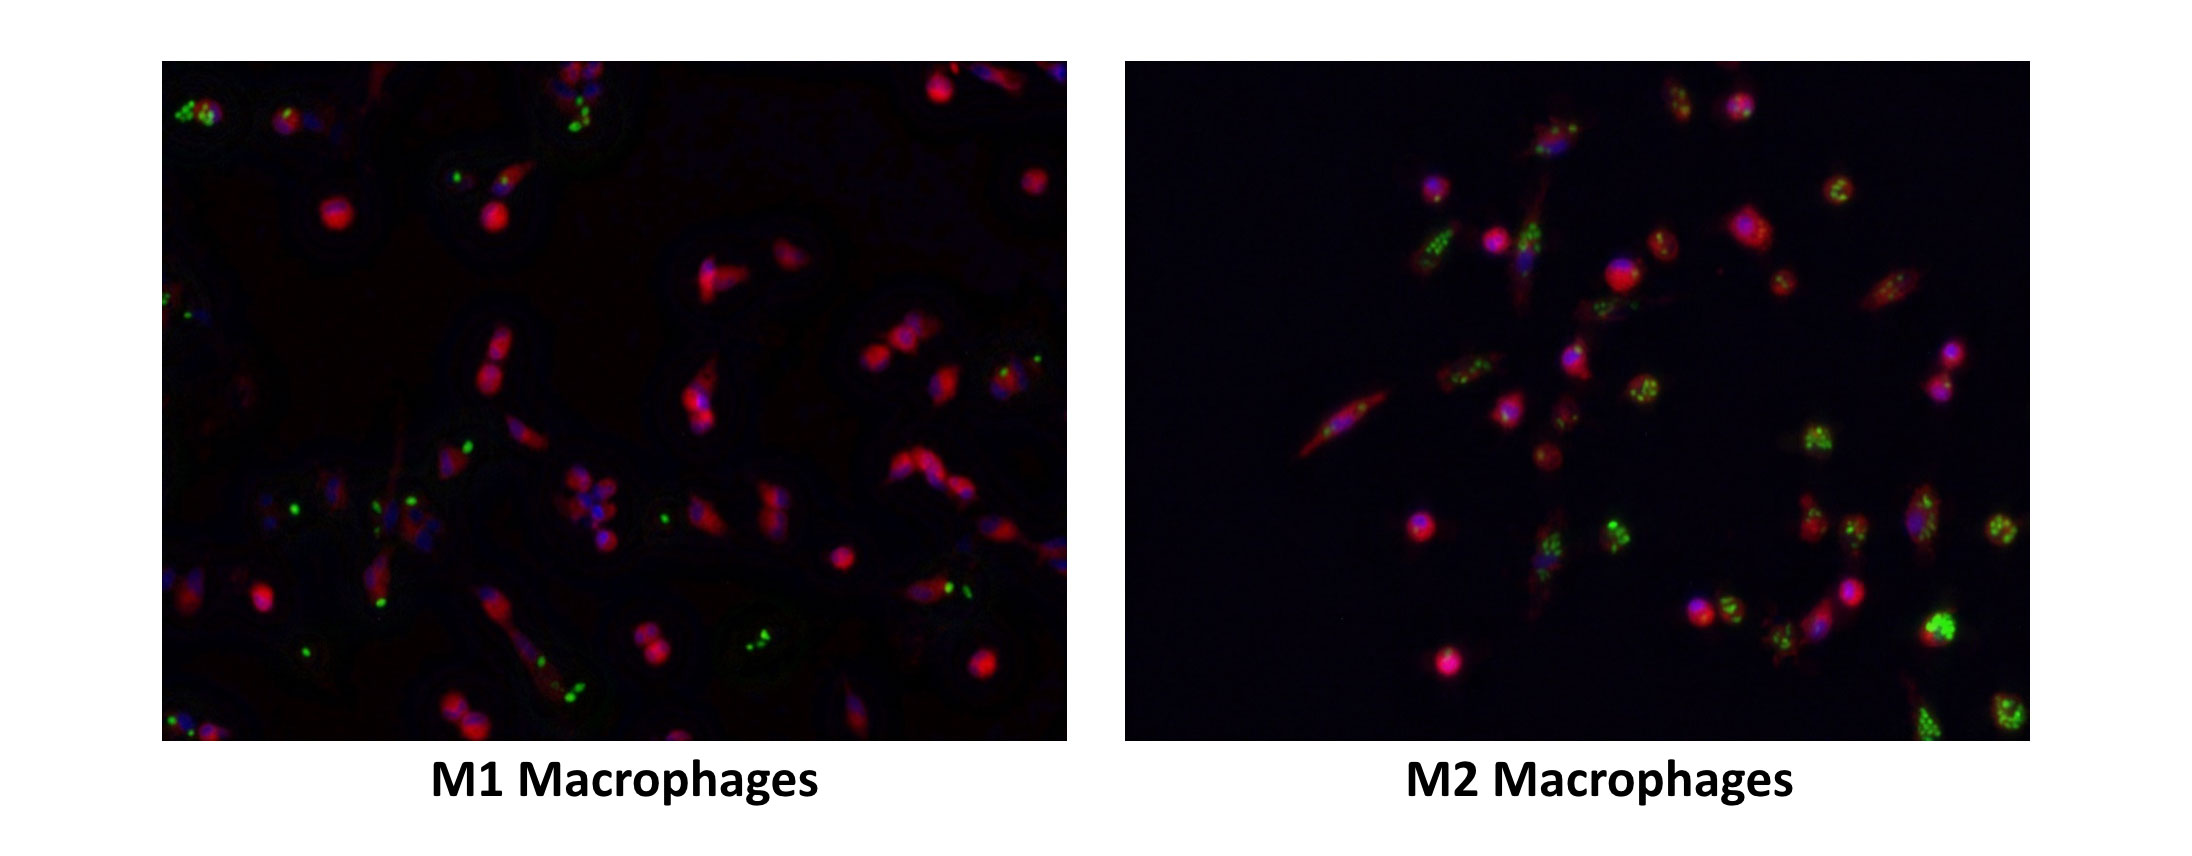
Primary monocytes (CD14+) were isolated from PBMCs of healthy donors and were treated with M-CSF for 6 days. On day 6, the naïve macrophages were exposed to GM-CSF + IFNγ and M-CSF to generate M1 and M2 macrophages (MΦ) respectively. The cells were then cultured with fluorescent zymosan particles for 3 h (green-phagocytic marker). After 3 hours, the cells were washed and then stained with a fluorescent membrane marker (red) and DAPI (blue-nucleus).
The images above showed that M2 macrophages engulfed higher numbers of zymosan particles when compared to M1 macrophages (Objective= 20X)
Difference in phagocytic potential of M1 and M2 MΦ
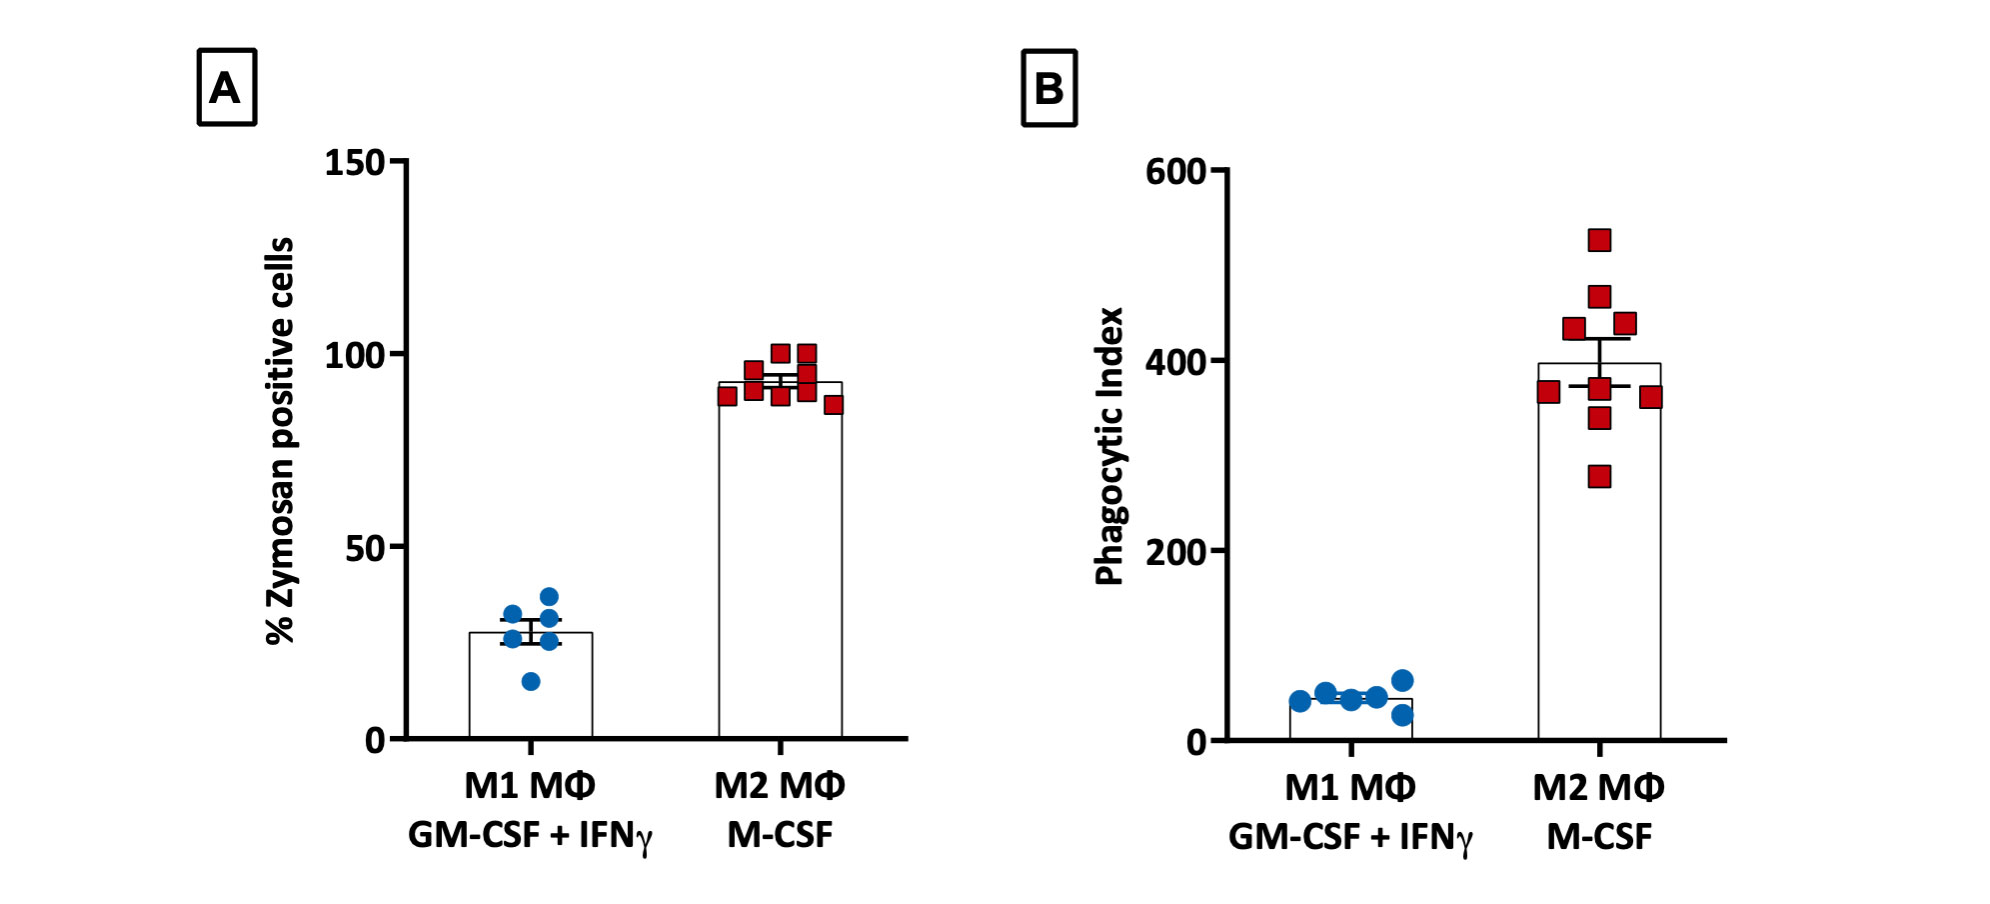
Fluorescent images from the phagocytosis assays were analysed using ImageJ. Each dot on the scatter plot represents 1 image field at 20X objective. [A] Percentage of Zymosan positive cells = (Cells with zymosan particles/ Total number of cells per field)*100; [B] Phagocytic Index = (Average number of particles per positive cell)/ Percentage of Zymosan positive cells. M2 Macrophages (n=9) showed higher phagocytic index when compared to M1 macrophages (n=5) [±SEM].
Stimulation of human monocyte derived macrophages with PMA
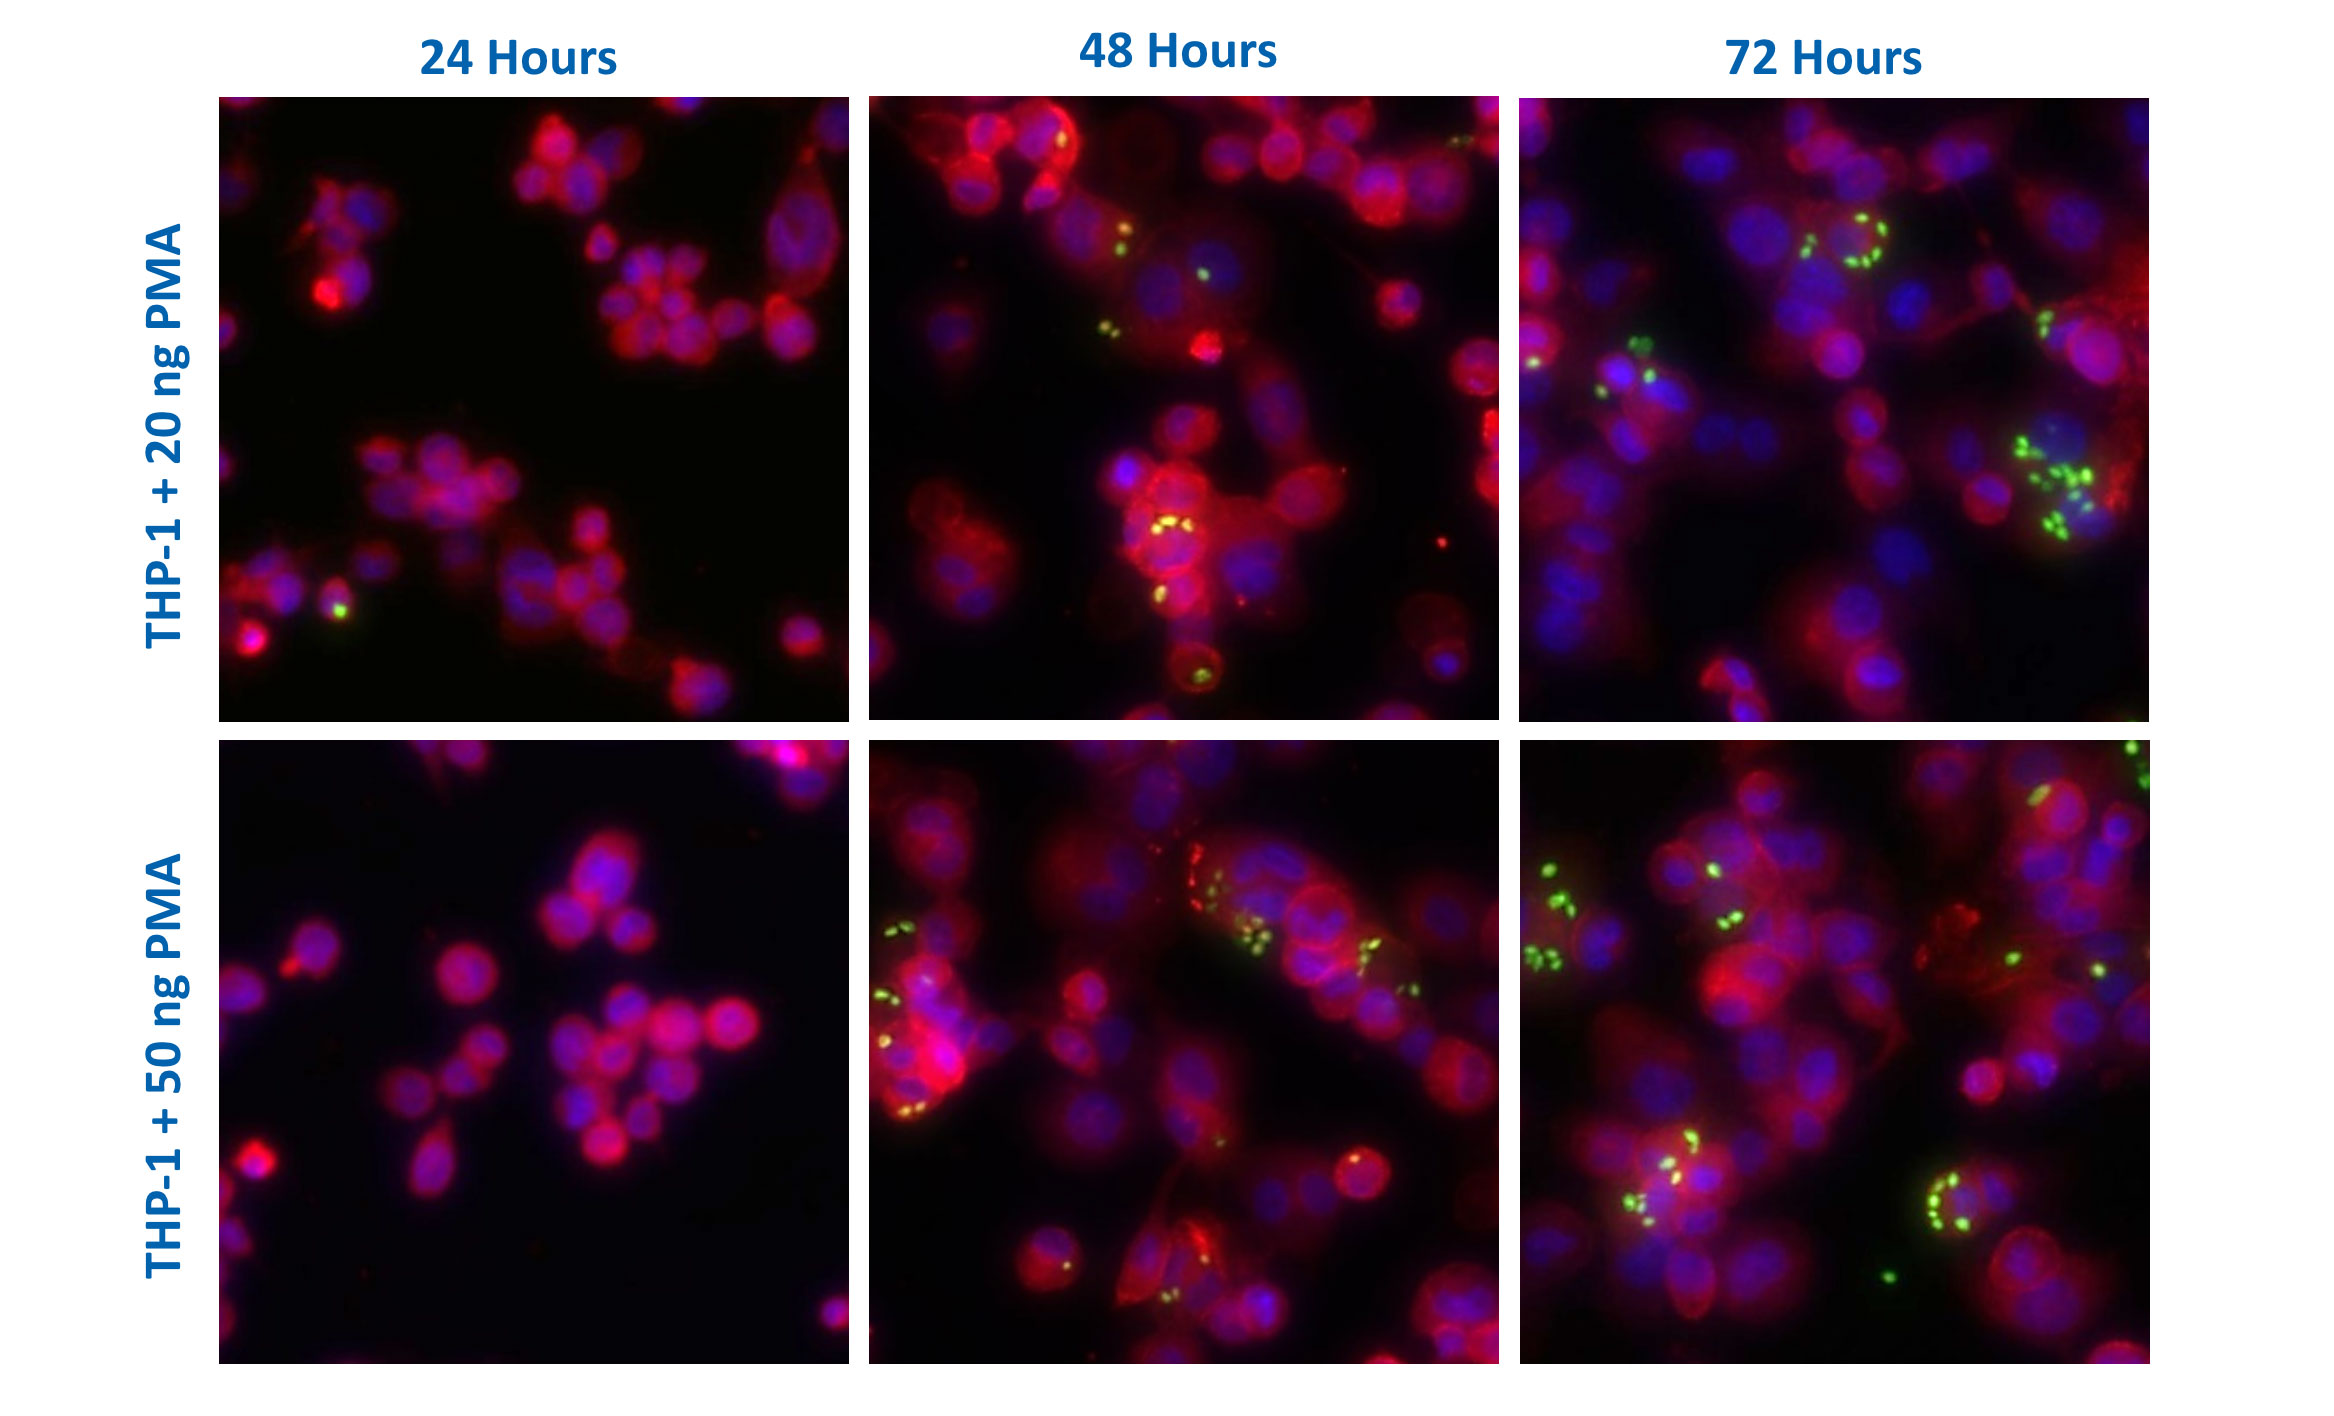
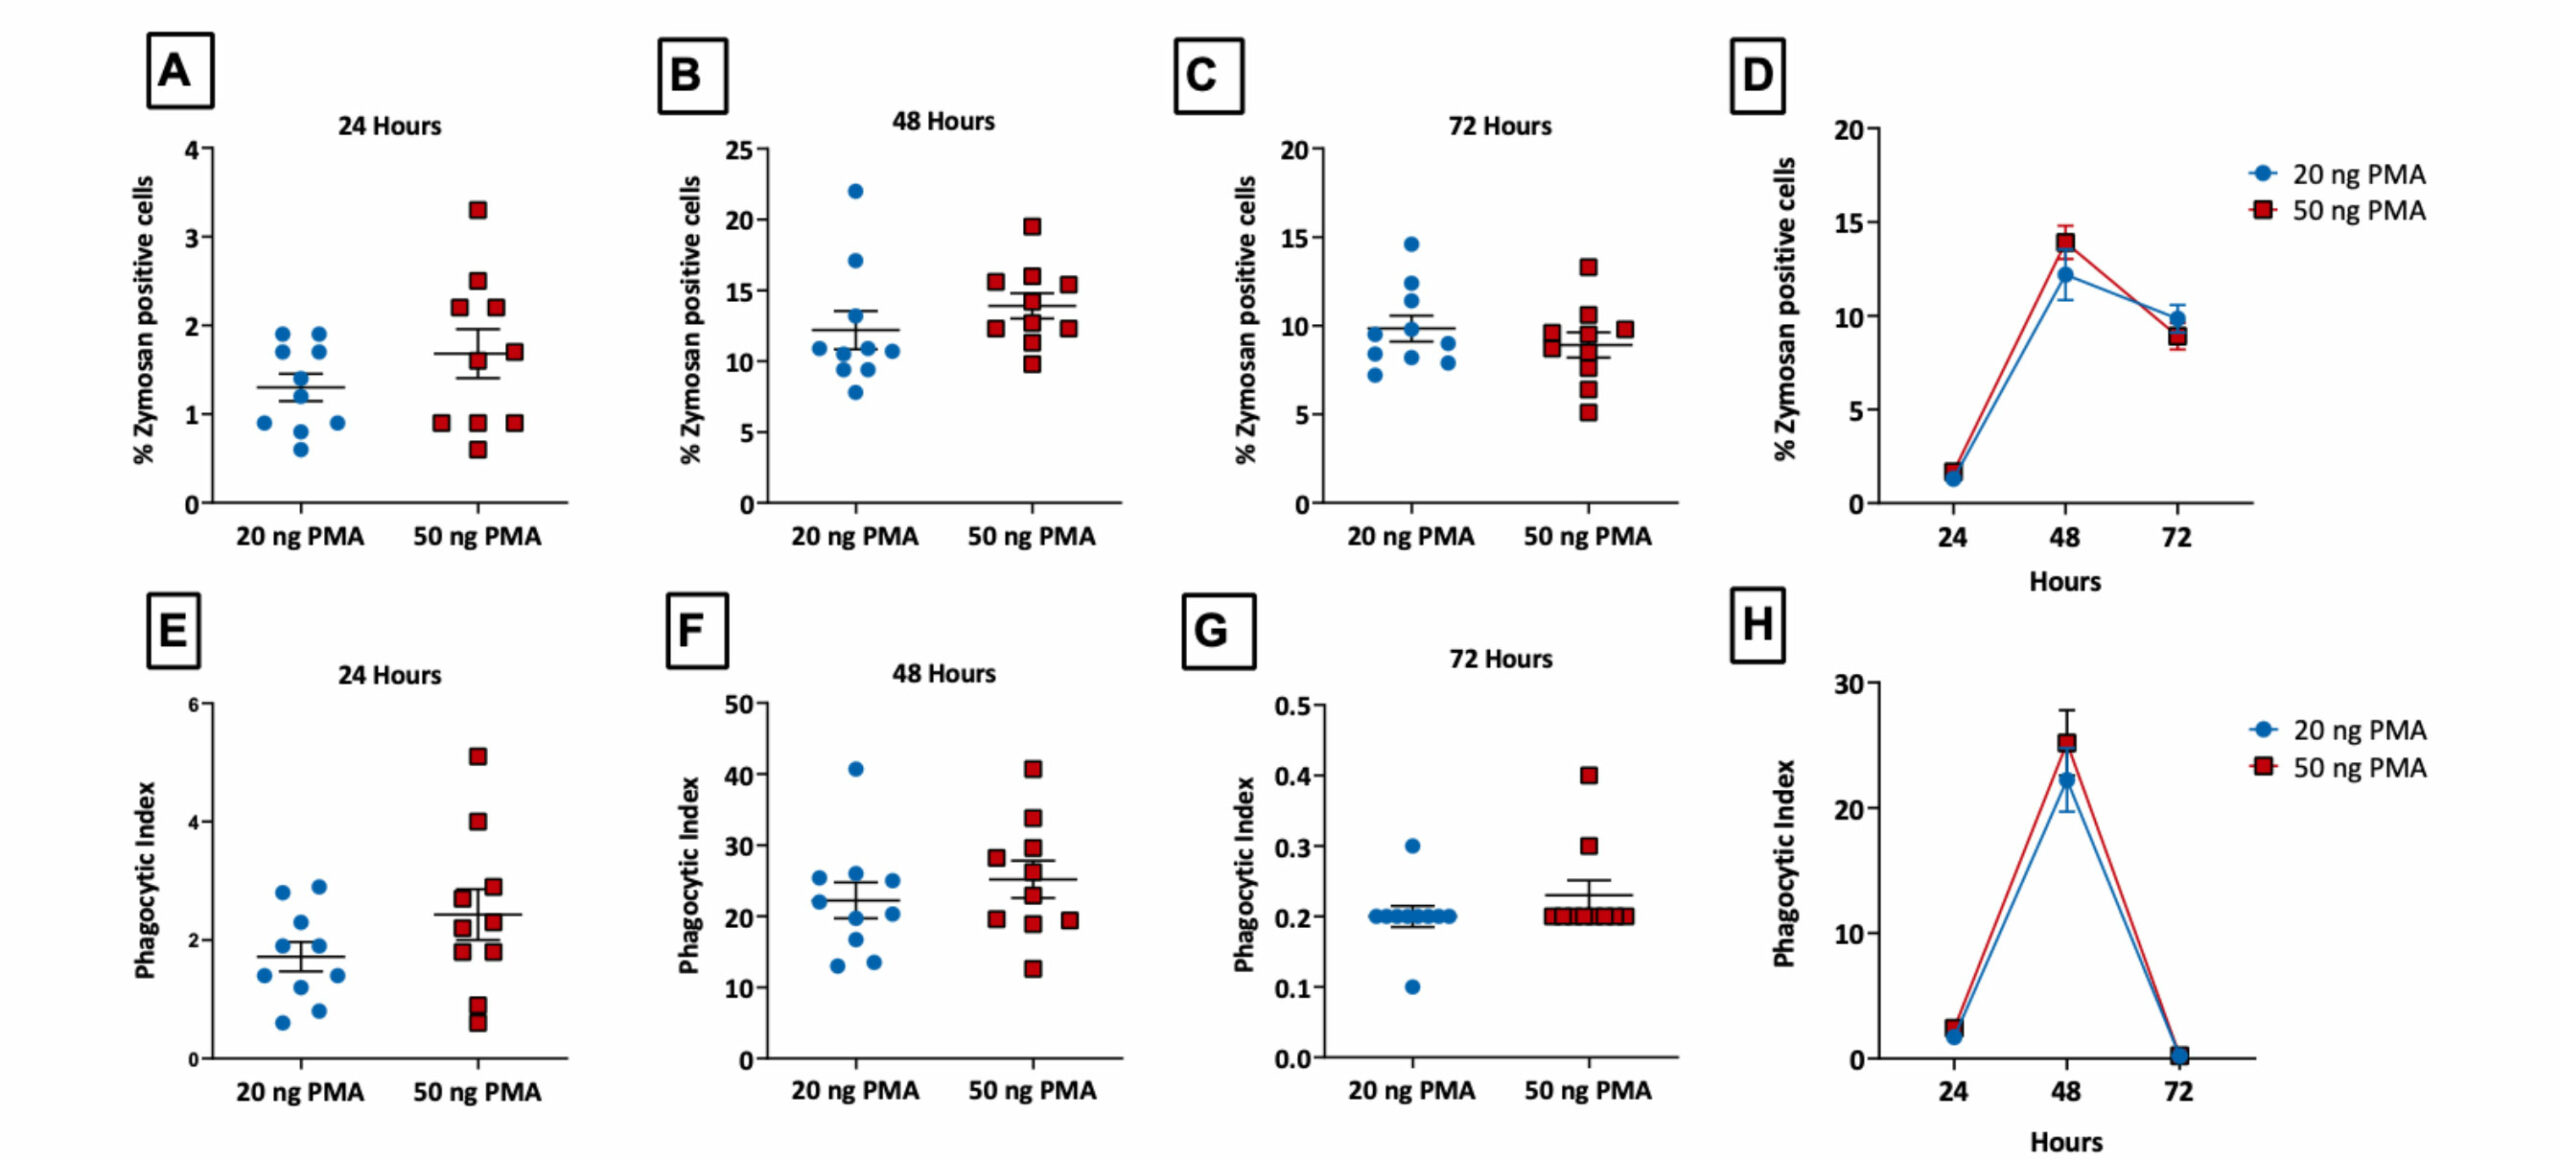
Phagocytosis assay using PMA-differentiated THP-1 cells
THP-1 cells (immortalised human monocyte model) were treated with PMA to induce macrophage like characteristics. Phagocytosis was subsequently assessed by incubating cells with fluorescent zymosan particles (green). The images were captured at 20x objective and analysed for phagocytic index using Image J (n=5±SEM).
Target Raji cells were pre-treated with or without Rituximab at different concentrations and stained with pHrhodo Red cell labelling dye. The THP-1 derived macrophages (effector cells) were stained with calcein (green). To assess antibody-dependent cellular phagocytosis, effector and target cells were co-cultures for 6 hours. Images were captured using the high content screening platform. Data is represented as the red fluorescence intensity (RFI) at basal – 0h and 6 h in all treatment groups.

THP-1 stimulation by PMA and cytokine release
Levels of multiple cytokines were measured following treatment of THP-1 (monocyte-like) cells with PMA for 72 hours allowing them to differentiate to macrophages.
ADCP assays
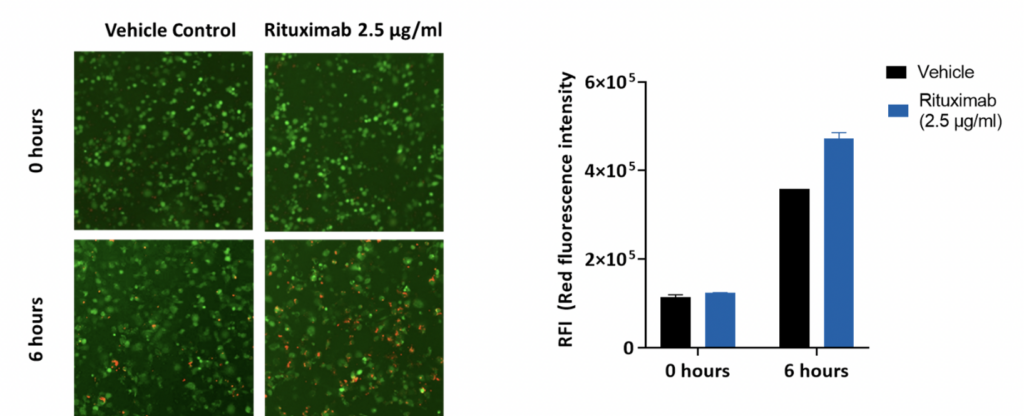
Target Raji cells were pre-treated with or without Rituximab at different concentrations and stained with pHrhodo Red cell labelling dye. The THP-1 derived macrophages (effector cells) were stained with calcein (green). To assess antibody-dependent cellular phagocytosis, effector and target cells were co-cultures for 6 hours. Images were captured using the high content screening platform. Data is represented as the red fluorescence intensity (RFI) at basal – 0h and 6 h in all treatment groups.
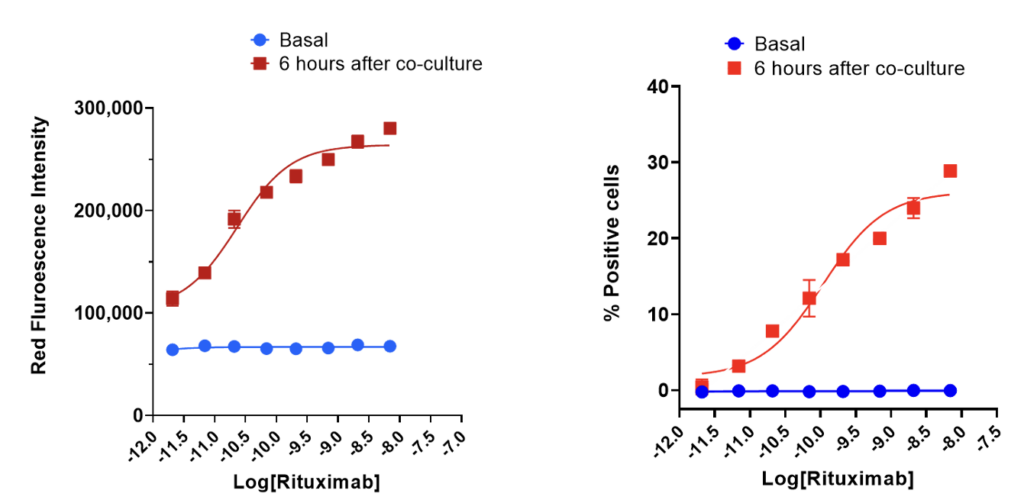
Prior to initiating the co-culture with THP-1 derived macrophages, Raji cells were treated with Rituximab (RTX) for 15 minutes prior to initiating the co-culture at an effector to target cell ratio of 1:1. Staining of Raji cells with Incucyte® phRodo® dye produces red fluorescent signals as a result of phagocytosis in response to the treatment conditions (A). The percentage of target cells positive for phagocytosis was determined by dividing the number of target cells (Raji) that have been phagocytosed relative to the total number of target cells (Raji) seeded at the start of co-culture (B). Data was represented as the mean±SEM of 2 replicates.

The phagocytic activity of primary macrophage towards MCF-7 breast cancer cells treated ± HER2 targeting monoclonal antibody Trastuzumab.
MCF-7 breast cancer cells were treated with different concentrations of Trastuzumab for 1 hour prior to initiating the co-culture with primary-derived macrophages at an effector to target ratio of 3:1. Staining of MCF-7 cells with Incucyte® phRodo® dye produces red fluorescent signals as a result of phagocytosis in response to the treatment conditions (A). The percentage of target cells positive for phagocytosis was determined by dividing the number of target cells (MCF-7) that have been phagocytosed relative to the total number of target cells (MCF-7) seeded at the start of co-culture (B). These two parameters were assessed at 0 and 6 hours post co-culture. Data was represented as the mean ± SEM of 3 replicates.
Request a consultation with Cellomatics Biosciences today
Our experienced team of in vitro laboratory scientists will work with you to understand your project and provide a bespoke project plan with a professional, flexible service and a fast turnaround time.
To request a consultation where we can discuss your exact requirements, please contact Cellomatics Biosciences.