Migration Assays
Immune cells play an important regulatory role in immune homeostasis. To support this process, migration of immune cells is critical for the delivery of protective immune responses to tissues.
Migration/Chemotaxis
Chemotaxis, is a critical phenomenon in the body’s defence against infections, injuries, and diseases. At its essence, chemotaxis denotes the directed movement of cells along a chemical gradient—a pivotal process orchestrating the timely arrival of immune cells at sites of infection or injury. Chemotaxis functions as the immune system’s navigational system, steering immune cells to the front lines where their presence is urgently required. Crucial to the body’s defence against infections, it plays a pivotal role in the process of wound healing.
Cancer disease management is often plagued by metastasis (migration) of cancer cells to distant locations from the primary growth site and invading into nearby tissues to establish secondary tumours. Disabling cell motility is one strategy to delay disease progression.
Transwell systems allow quantification of cell migration following drug treatment between the apical and basal chambers across a membrane, mimicking physiological conditions. This method has been employed for our suspension cell lines wherein movement between the two compartments is mediated by chemoattractants.
At Cellomatics, we utilise our immunological skills to support clients in pre-clinical compound screening. By leveraging our ability to access freshly isolated immune cells onsite, we irradicate any issues arising from long term storage of blood. Our capabilities include measuring both end-point luminescence and fluorescence-based techniques, allowing us to measure significant numbers of compounds in a single experiment, generating multi-point concentration response curves in a single sitting.
- Assays are performed on freshly isolated, healthy human peripheral blood derived neutrophils
- End point Measurement of Migrated cells:
- Translucent/ transparent transwells
- End point measurements:
- Cell Titre Glo assay can be performed on the migrated cells
- Migrated cells can be counted after staining with cell dyes
- Migrated cells can be counted using cell counter
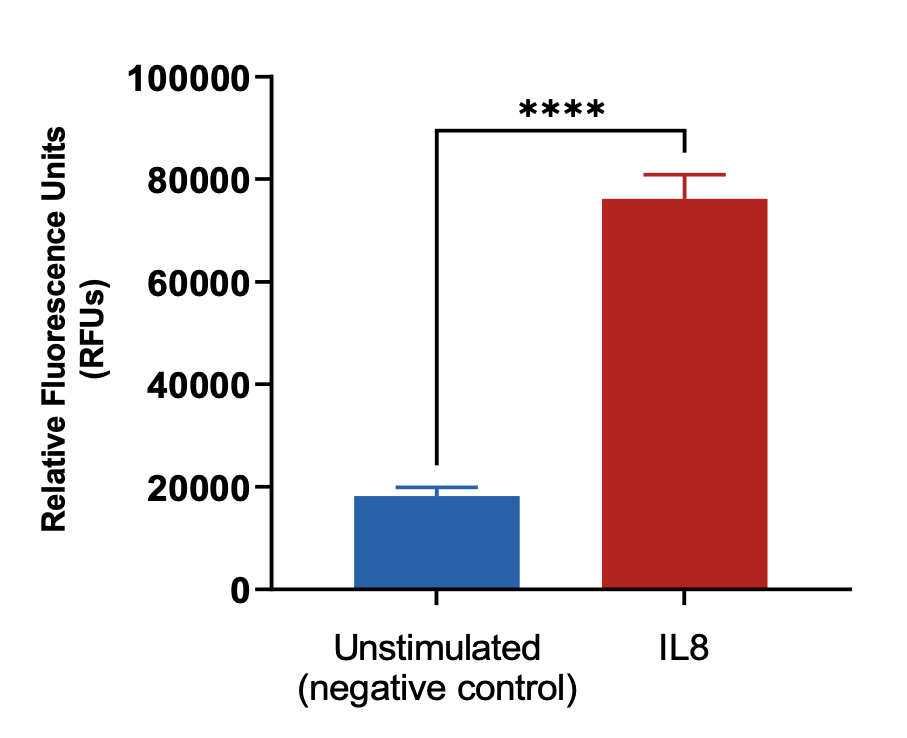
Neutrophils were stained with Calcein AM and added to the top chamber of the transwell. Recombinant IL8 was then added to the bottom chamber. At the end of the assay, cells in the basal chamber were quantified. Each condition is representative of three independent biological repeats (**p<0.05, n=3±SEM).
Neutrophil CXCL5-induced chemotaxis
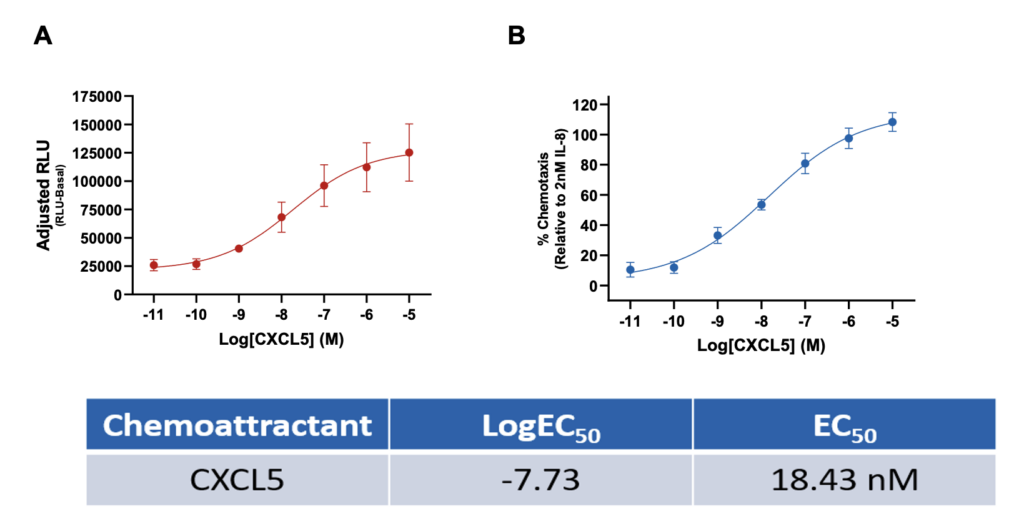
Measurement of primary neutrophil chemotaxis by the chemoattractant CXCL5. (A) CXCL5-induced chemotaxis as adjusted RLU (RLU-basal) values and (B) percentage increase of neutrophil chemotaxis compared to 2nM IL-8. Data are represented as n=3 ± SEM.
Neutrophil Chemotaxis Antagonist Assay
- The experiment is performed to assess the effects of antagonists with IL-8 or fMLP -induced chemotaxis assays in neutrophils, with examples to follow
- Cell type: Freshly isolated Neutrophils
- A range of concentrations of the antagonist are used to challenge the chemoattractant activity
- Conditions:
- IL-8 + Navaraxin
- fMLP+ HCH6-1
- CXCL5 + SB225002
Navarixin inhibits IL-8 induced neutrophil chemotaxis

The inhibition of IL-8 (CXCL8) induced chemotaxis by the selective CXCR1/2 antagonist Navarixin. (A) Navarixin inhibition of IL-8 induced chemotaxis as adjusted RLU (RLU-basal) values and (B) percentage inhibition of IL-8 induced neutrophil chemotaxis by Navarixin. Data are represented as n=3 ± SEM.
HCH6-1 inhibits fMLP induced neutrophil chemotaxis

Data representing (A) HCH6-1 inhibition of fMLP induced chemotaxis as adjusted RLU (RLU-basal) values and (B) percentage inhibition of fMLP induced neutrophil chemotaxis by HCH6-1. Data are represented as n=3 ± SEM.
SB225002 inhibits CXCL5 induced neutrophil chemotaxis
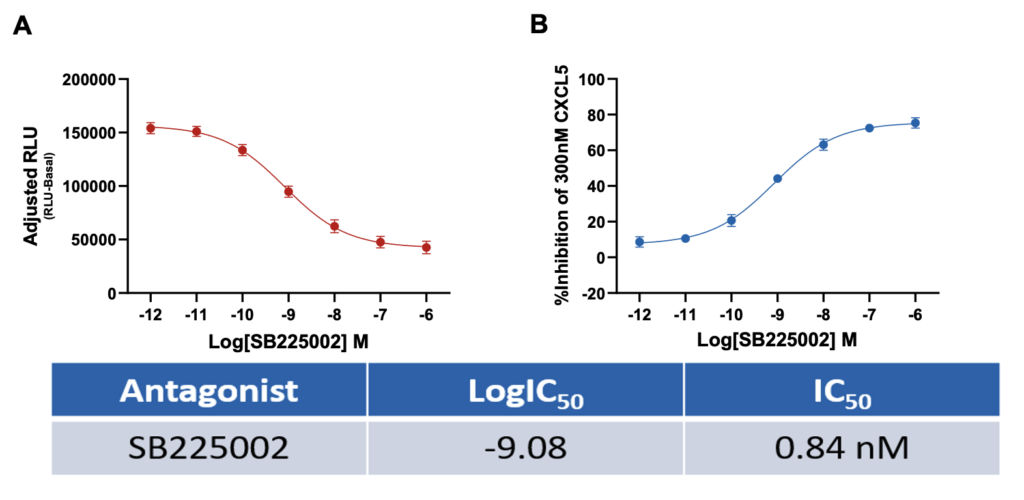
Data representing (A) SB225002 inhibition of CXCL5 induced chemotaxis as adjusted RLU (RLU-basal) values and (B) percentage inhibition of CXCL5 induced neutrophil chemotaxis by SB225002. Data are represented as n=3 ± SEM.
Quantification of Chemotaxis

Standard curve of neutrophil cell numbers from a single donor versus released luminescence from a Cell Titre Glo assay. Values from maximum concentration of CXCL5 show cell migration of 10620 cells into the basal chamber. Data is representative of n=1 in triplicate (R2=0.99)
VEGF induced THP-1 (monocyte) chemotaxis across endothelial cell (HUVEC) monolayer
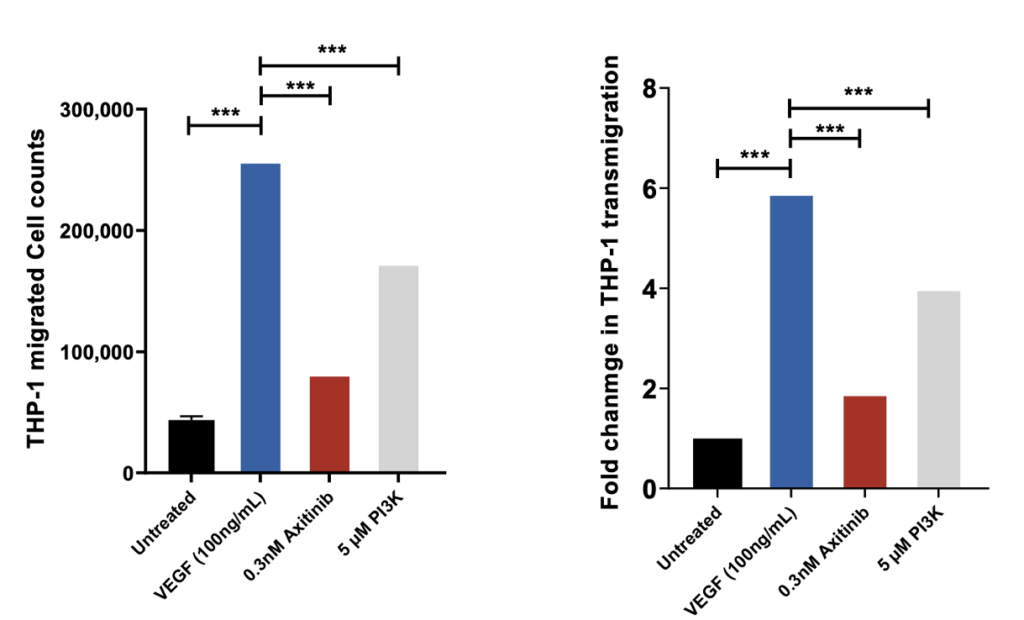
THP-1 migrated cell counts are indicative of the number of cells that have passed through the HUVEC monolayer into receiver wells as a direct measure of the permeability of the HUVEC monolayer following drug treatment. Axitinib/VEGF-165 and PI3Kinhibitor/VEGF-165 co-treatment demonstrates significant inhibition of VEGF induced transmigration of THP-1 cells suggesting inhibition of HUVEC monolayer permeability; n=3; mean ± SEM.
MCP-1/CCL2 induced THP-1 (monocyte) chemotaxis
THP-1 cells were stained with Calcein AM and added to the top chamber of the transwell. MCP-1 was then added to the basal chamber in the presence or absence of Wortmannin (PI3K inhibitor). Following 2-hour incubation, cells migrating to the basal chamber of the experimental set-up was quantified using the JuLITM Stage imaging platform. Wortmannin serves as a positive control for the inhibition of THP-1 migration.
SDF-1 induced primary monocyte chemotaxis
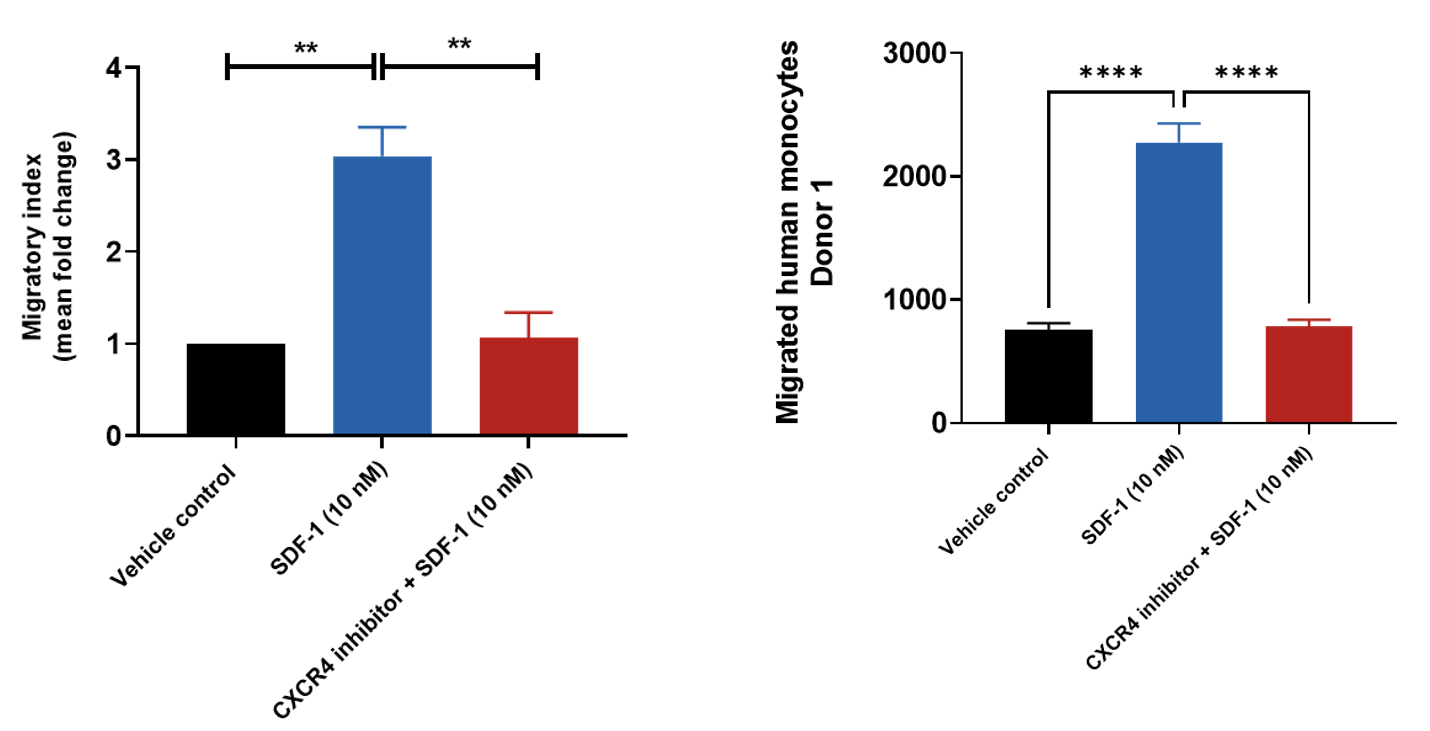
Human peripheral blood derived CD14+ monocytes were stained with Calcein AM and added to the top chamber of the transwell. SDF-1was then added to the basal chamber in the presence or absence of CXCR4 inhibitor. At the end of the 4- hour migration, the number of cells that migrated into the basal chamber of the experimental set-up was quantified using the JuLITM Stage imaging platform. Relative fold-changes were also determined for each treatment condition using the Vehicle control.
SDF-1 and EMAP II induced primary monocyte chemotaxis

Chemotaxis of freshly isolated CD14+ monocytes induced by EMAP II and SDF1-α chemoattractants. (A) Luminescence signal (with basal luminescence removed) produced by SDF1-α and EMAP II over a range of concentrations. (B) Concentration-response curves produced as percentage chemotaxis relative to 1µM SDF1-α. The results are the mean(±SEM) of 3 donors.
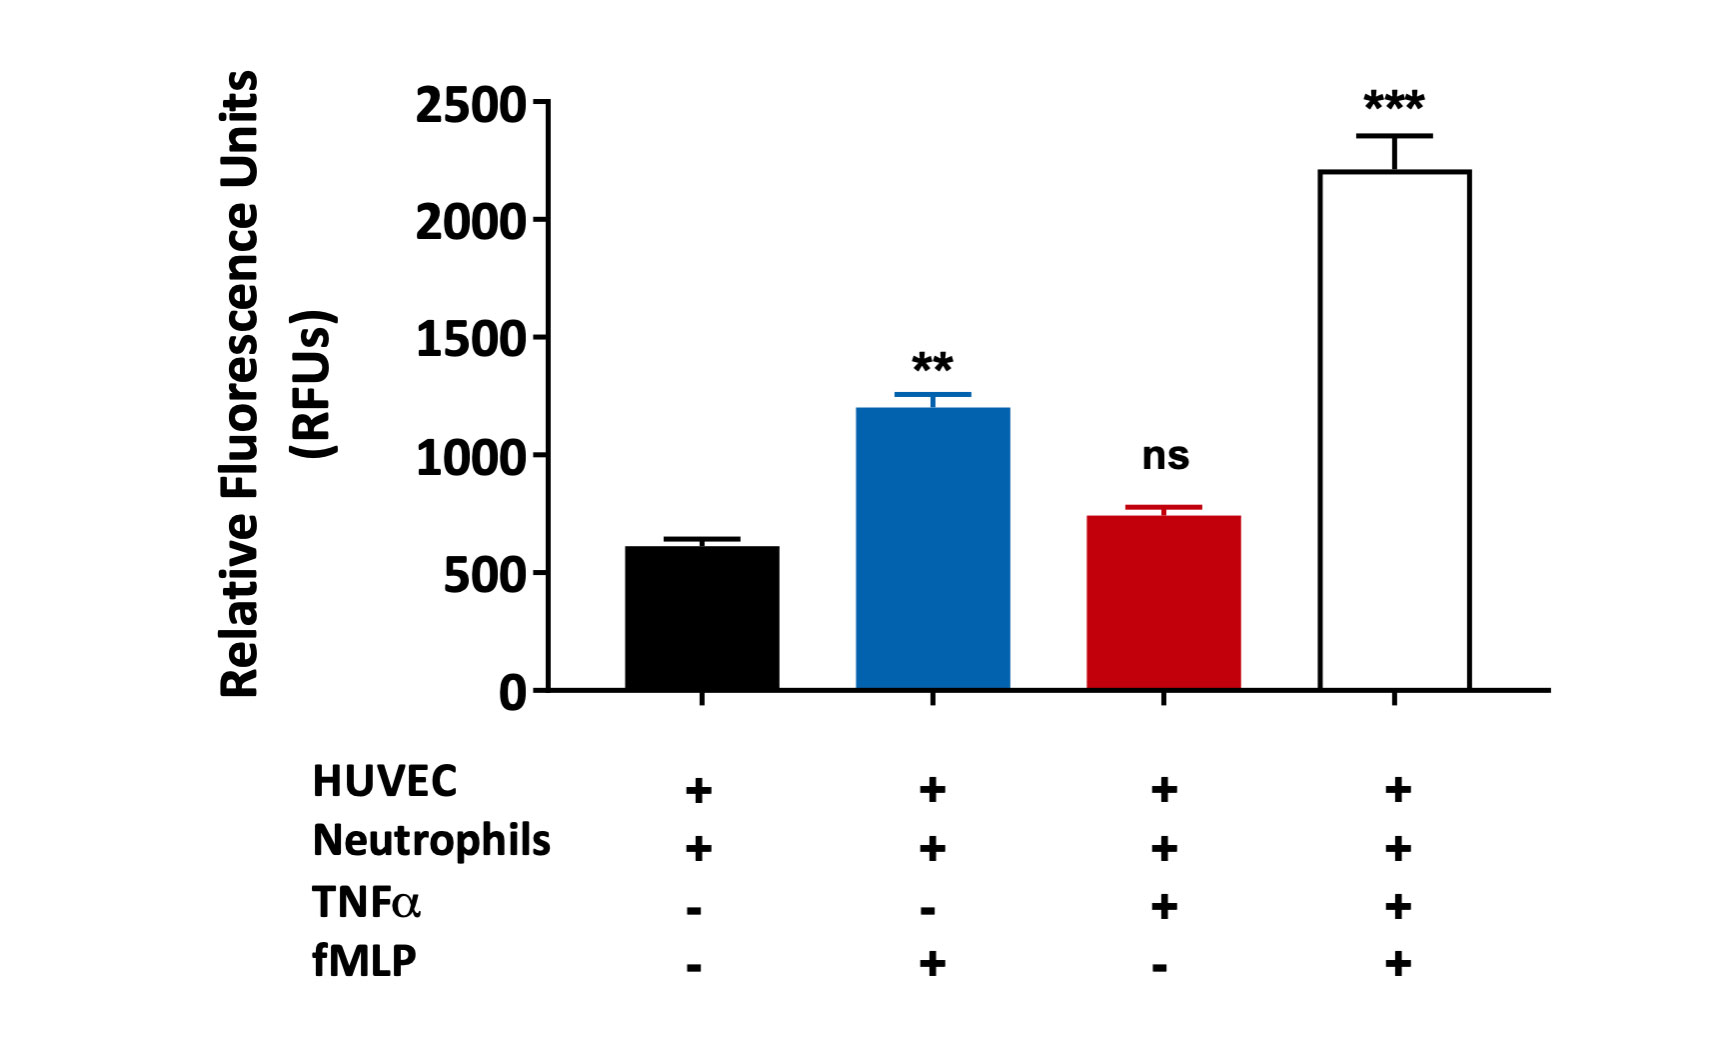
fMLP induced primary neutrophil chemotaxis across TNFα treated HUVEC monolayer
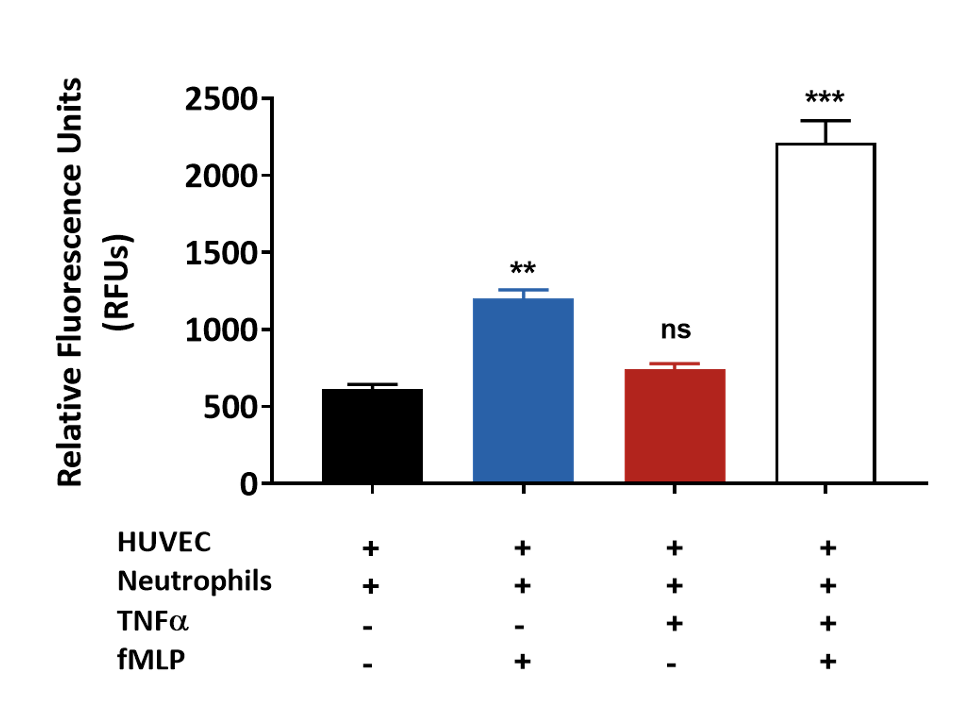
Primary human neutrophil migration induced by fMLP across a HUVEC monolayer treated with TNFα. Results are graphically presented using GraphPad Prism (Version 8.0.2) software.
Effect of test antibody on CCL2 induced THP-1 (monocyte) chemotaxis
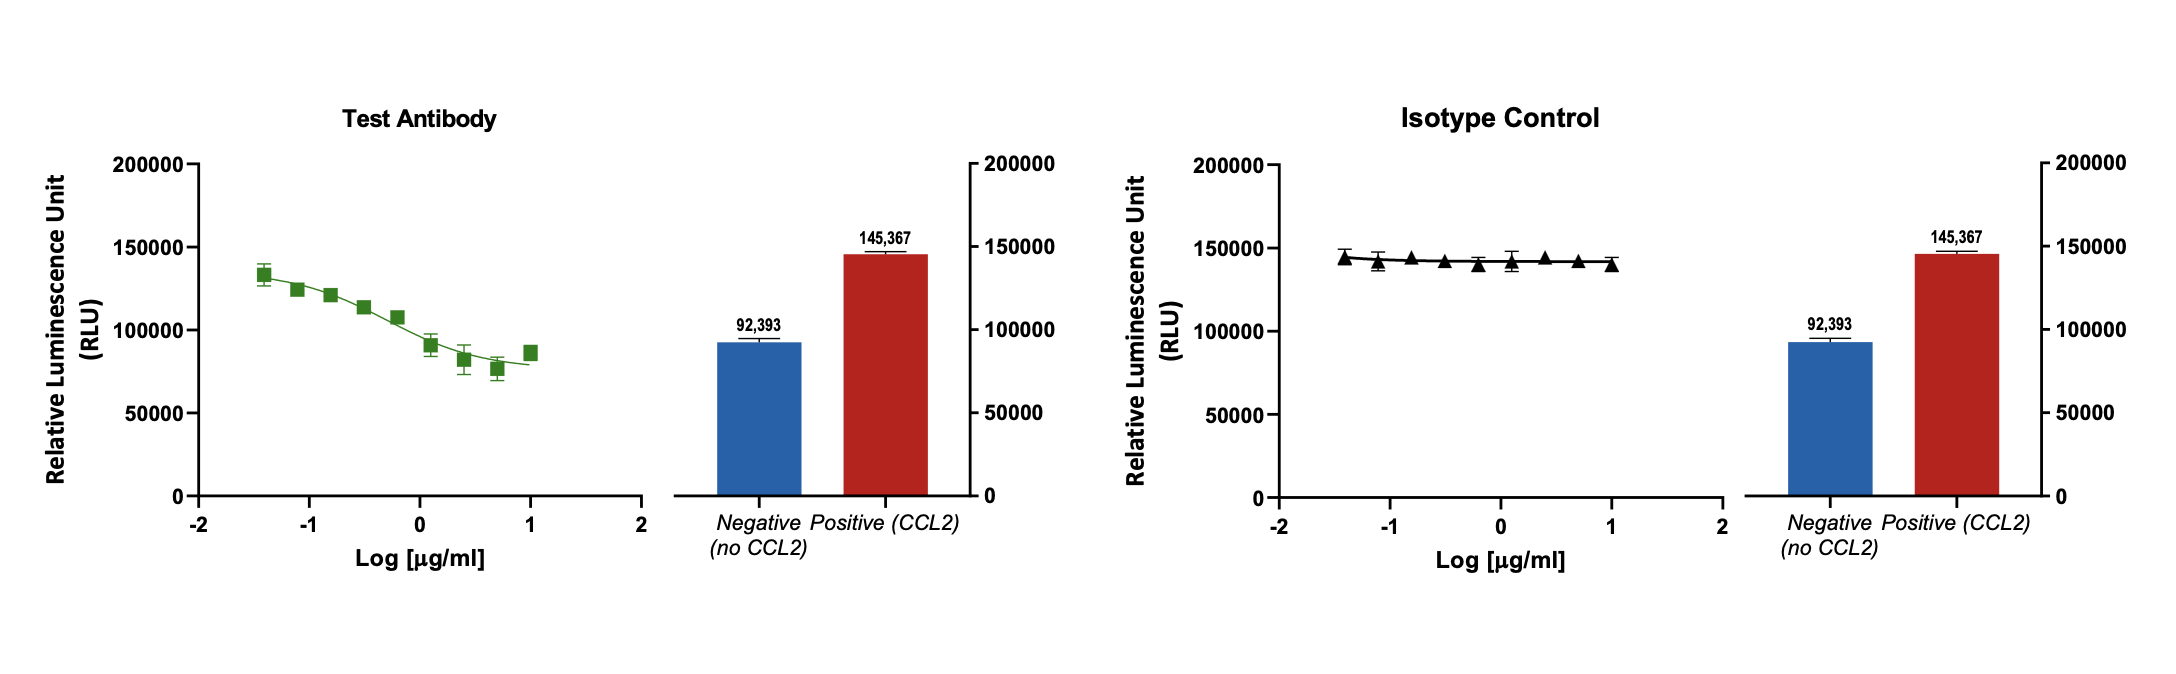
CCL2 induced THP-1 (monocytic cell line) migration is reduced by the test antibody in a concentration dependent manner (n=3; ± SEM). Isotype treatment has no effect on cell migration.
Effect of test antibody on CCL20 induced CD4+ T cells chemotaxis
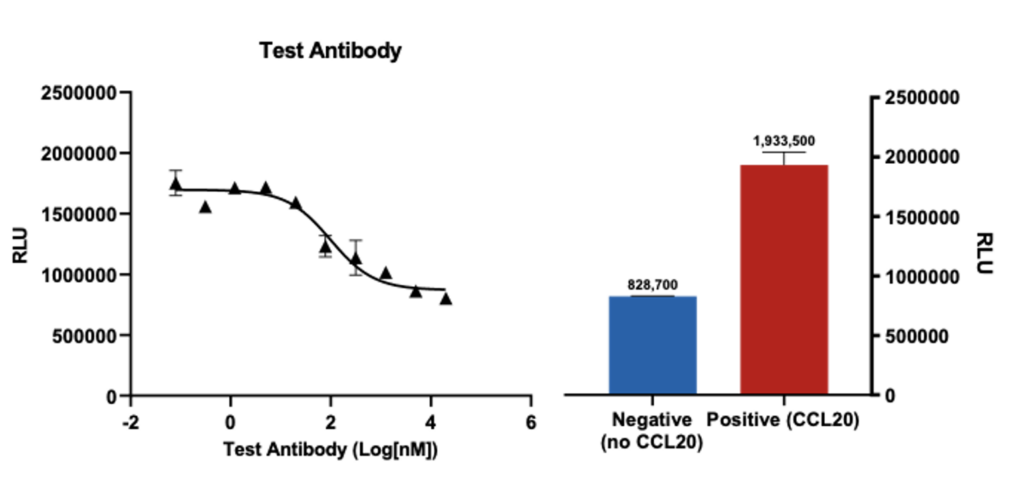
Primary CD4+T cells (anti-CD3/anti-CD28 activated) migration towards CCL20 (n=3; ± SEM) is inhibited by the test antobody in a dose dependent manner. Cell migration was analysed using Cell-Titre Glo and plotted as relative luminescence units (RLU).
Chemokinesis

A scratch was formed on a A549 cell monolayer and treated with Olaparib (Ola), 5-Fluorouracil (5-FU); a combination of 5-fluorouracil and Olaparib (5-FU + Ola). Images were acquired using live imaging platform at the indicated time points (hrs). the wound size/scratch was measured at all time points. The wound closure percentage was analysed assuming 0& closure at 0 hours, and calculating all the following time points as ratio to 0 hours [*p<0.01; ± SEM].
Request a consultation with Cellomatics Biosciences today
Our experienced team of in vitro laboratory scientists will work with you to understand your project and provide a bespoke project plan with a professional, flexible service and a fast turnaround time.
To request a consultation where we can discuss your exact requirements, please contact Cellomatics Biosciences.